This is a really great chart, thanks for putting this together. If be interested to see how the best proteins on the chart for cost/CO2 compare vs their protein per calorie rato.
[deleted]
[deleted]
PM_ME_UR_GOOD_VIBE
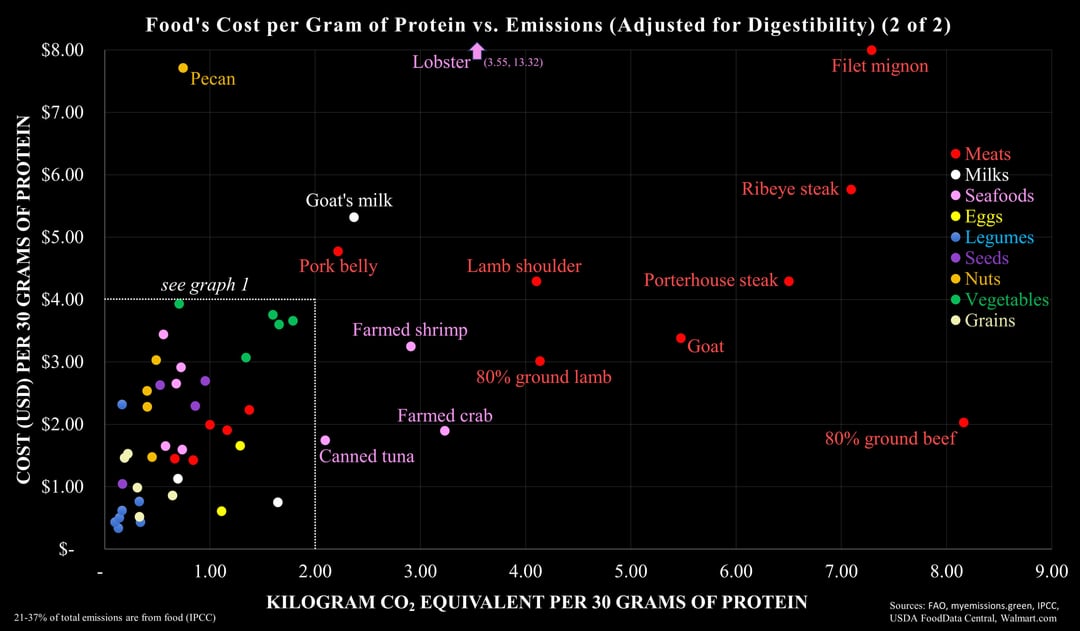
Cool but wondering does how does 80% ground beef and ground pork skew compared to 95% lean ground beef/pork?
bethanechol
I always love your charts, and this one might be the most useful to me!
I would be very curious to see where canned sardines and mussels fall on this chart, those are two increasingly popular items that I frequently hear touted for their sustainability

5 Comments
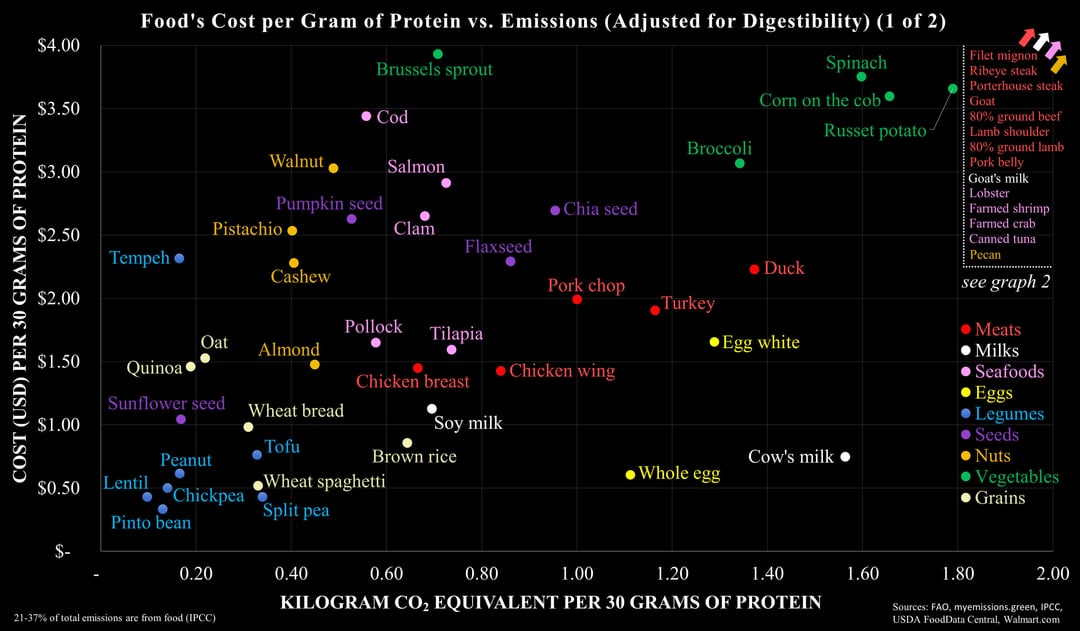
Sources:
1. My Emissions for emissions by food: [https://myemissions.green/food-carbon-footprint-calculator/](https://myemissions.green/food-carbon-footprint-calculator/)
2. USDA FoodData Central for macronutrient content: [https://fdc.nal.usda.gov/](https://fdc.nal.usda.gov/)
3. Walmart for pricing (North Carolina region): [https://www.walmart.com/](https://www.walmart.com/) , IndexBox for pricing on goat meat: [https://www.indexbox.io/search/goat-meat-price/](https://www.indexbox.io/search/goat-meat-price/)
4. True digestibilities from FAO (e.g. page 32): [https://books.google.com/books?hl=en&lr=&id=ieEEPqffcxEC&oi=fnd&pg=PA21&ots=IwxKL9oYKa](https://books.google.com/books?hl=en&lr=&id=ieEEPqffcxEC&oi=fnd&pg=PA21&ots=IwxKL9oYKa)
5. IPCC for 21-37% of total emissions are from food: [https://www.ipcc.ch/srccl/chapter/chapter-5/](https://www.ipcc.ch/srccl/chapter/chapter-5/)
Tools: Microsoft Excel
This is a really great chart, thanks for putting this together. If be interested to see how the best proteins on the chart for cost/CO2 compare vs their protein per calorie rato.
[deleted]
Cool but wondering does how does 80% ground beef and ground pork skew compared to 95% lean ground beef/pork?
I always love your charts, and this one might be the most useful to me!
I would be very curious to see where canned sardines and mussels fall on this chart, those are two increasingly popular items that I frequently hear touted for their sustainability