

Experimental setup
PyTorch (pytorch.org, accessed on December 1, 2023) was used for code implementation, and the University of Arizona’s high-performance computing platform was used for all training.
Performance metrics
The dataset was used to create a classification system, and four main analytical metrics were created to assess its performance: false negative (TN), false positive (FP), true positive (TP), and false negative (FN).
A classification model’s effectiveness is assessed by calculating true assumptions to total assumptions of the assumptions that were made (ACC):
$$Accuracy\;\left( {ACC} \right) = \frac{TP + TN}{{TP + FP + TN + FN}}$$
(15)
The number of positively detected examples relative to all positive examples is measured by the positive predictive value, or PR:
$$Precision\;\left( {PR} \right) = \frac{TP}{{TP + FP}}$$
(16)
The proportion of cases classified as positively out of each positive instance is referred to as the real-positive rate (TPR) or sensitivity.
$$Recall\;\left( {RC} \right) = \frac{TP}{{TP + FN}}$$
(17)
The F1 is an individual numerical value that represents a metric that combines PR and RC:
$$F1{ – }score\left( {F1} \right) = \frac{Precision*Recall}{{Precision + Recall}}$$
(18)
Feature extraction validation
Table 1 provides the feature extraction validation analysis of the proposed VGG model with other existing models.
Table 1 Feature extraction analysis of the VGG model.
Table 1 presents a comprehensive feature extraction analysis comparing various DL models, including AlexNet, ResNet, GoogleNet, XceptionNet, and a proposed VGG model. Each model’s performance metrics are displayed, including F1 score, recall, accuracy, and precision. AlexNet achieved an accuracy of 95.07%, with recall, precision, and F1 score values of 95.88%, 94.19%, and 95.03%, respectively. ResNet demonstrated higher accuracy at 96.88%, along with recall, precision, and F1 score all hovering around 96.88%. GoogleNet further improved the metrics with an accuracy of 97.45% and recall, precision, and F1 score values peaking at 97.57%, 97.33%, and 97.45%, respectively. XceptionNet continued the trend of improvement, achieving an accuracy of 98.50% and exhibiting recall, precision, and F1 score values of 98.57%, 98.42%, and 98.50%. The proposed VGG model outperformed all others, achieving an exceptional accuracy of 99.77%, with recall, precision, and F1 score values of 99.72%, 99.63%, and 99.73%, respectively, indicating its superiority in feature extraction analysis. Figure 4 depicts the feature extraction analysis.
Fig. 4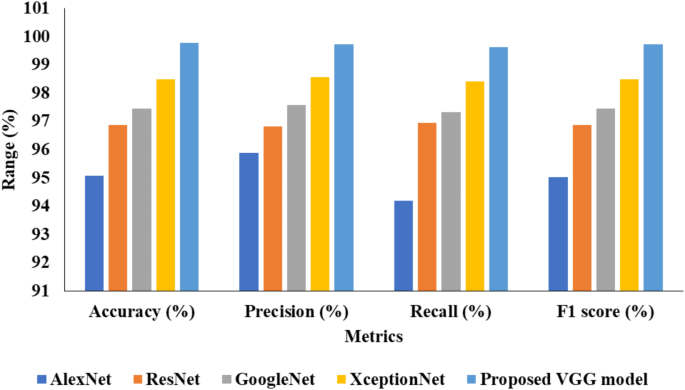
Analysis of feature extraction.
Food classification analysis
Table 2 describes the classification validation of the suggested Hybrid Transformer model using various food items.
Table 2 Classification validation of the suggested Hybrid Transformer model.
Table 2 showcases the classification validation results of the proposed Hybrid Transformer model across various classes. Each class, including apple juice, almond milk, banana, sweet milk, green soda, pizza (seafood), bread and butter, castela, and cherryade, is evaluated based on its precision, accuracy, recall, and F1 score. Apple juice achieved an accuracy of 98.43%, with precision, recall, and F1 score values of 98.66%, 99.38%, and 99.55%, respectively. Almond milk closely followed with an accuracy of 98.56%, exhibiting recall, precision, and F1 score values of 99.12%, 99.07%, and 99.16%. Banana demonstrated the highest accuracy among the classes at 99.66%, with recall, precision, and F1 score values of 99.73%, 99.59%, and 98.92%. Sweet milk achieved an accuracy of 99.21%, showcasing recall, precision, and F1 score values of 99.27%, 98.67%, and 99.34%. Green soda maintained high performance with an accuracy of 98.75%, precision of 98.89%, recall of 99.67%, and F1 score of 99.35%. Pizza (seafood) achieved an accuracy of 98.63%, exhibiting recall, precision, and F1 score values of 99.45%, 99.77%, and 99.27%. Bread and butter excelled with an accuracy of 99.71%, showcasing recall, precision, and F1 score values of 99.61%, 98.88%, and 99.72%. Castela maintained a high accuracy of 99.80%, with precision, recall, and F1 score values of 98.68%, 98.73%, and 98.75%, respectively. Finally, cherryade demonstrated an accuracy of 98.82%, with recall, precision, and F1 score values of 99.04%, 99.22%, and 99.49%, respectively, indicating the effectiveness of the Hybrid Transformer model across diverse classification tasks. Figure 5 illustrates the analysis of the proposed model’s classification.
Fig. 5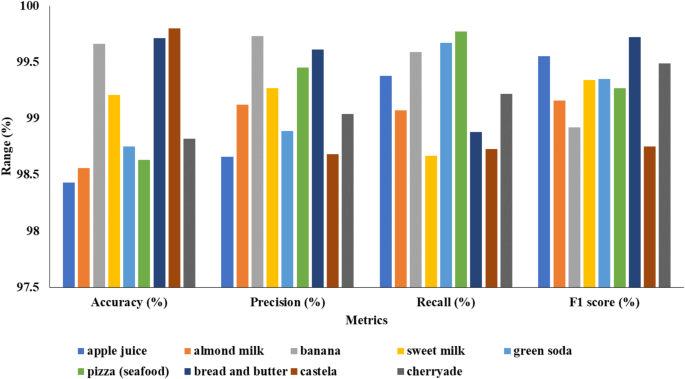
Classification analysis of Hybrid Transformer model.
Table 3 represents the classification analysis of the suggested Hybrid Transformer model with other existing models.
Table 3 Comparison of classification models with proposed Hybrid Transformer model.
Table 3 presents a comprehensive comparison of various classification models with the proposed Hybrid Transformer model. The performance metrics of each method are highlighted for comparison, including precision, accuracy, recall, and F1 score. The Artificial Neural Network (ANN) achieved an accuracy of 97.08%, with recall, precision, and F1 score values of 96.43%, 97.09%, and 96.90%, respectively. The CNN demonstrated a slightly higher accuracy of 97.14%, along with recall, precision, and F1 score values of 97.48%, 97.14%, and 97.02%, respectively. Swin Transformer improved upon these metrics, achieving an accuracy of 98.00%, with recall, precision, and F1 score values of 98.58%, 98.00%, and 97.92%, respectively. Vision Transformer further enhanced the performance, attaining an accuracy of 98.57%, with recall, precision, and F1 score values of 98.86%, 98.51%, and 98.46%, respectively. However, the proposed Hybrid Transformer model outperformed all other methods, achieving exceptional accuracy of 99.83%, with recall, precision, and F1 score values of 99.47%, 99.79%, and 99.67%, respectively, indicating its superiority in classification tasks. Figure 6 provides the comparison of classification models in graphical format.
Fig. 6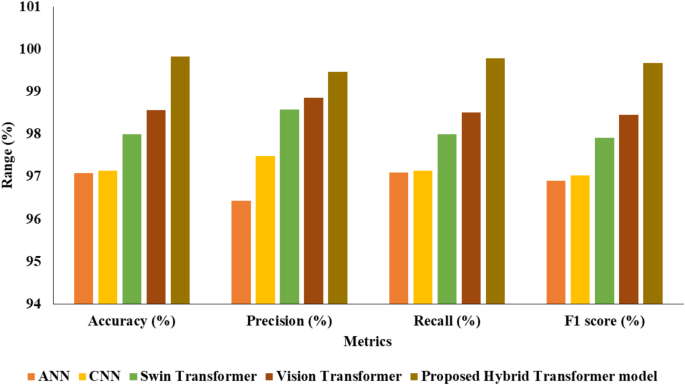
Classification models comparison with proposed Hybrid Transformer model.
Calorie estimation validation
Table 4 represents the classification analysis of the proposed Hybrid Transformer model with other existing models for calorie estimation.
Table 4 Comparison of classification models with proposed Hybrid Transformer model of calorie estimation.
Table 4 provides a comparative analysis of classification models, including Artificial Neural Network (ANN), Swin Transformer, Vision Transformer, Convolutional Neural Network (CNN), and the proposed Hybrid Transformer model, focusing on their performance in calorie estimation tasks. The metrics evaluated include accuracy (ACC), precision (PR), recall (RC), and F1 score (F1). The ANN achieved an accuracy of 91.60%, with precision, recall, and F1 score values of 92.13%, 93.15%, and 91.33%, respectively. The CNN model demonstrated improved performance with an accuracy of 94.52%, along with precision, recall, and F1 score values of 93.24%, 95.47%, and 93.55%, respectively. The Swin Transformer further enhanced accuracy to 96.33%, exhibiting precision, recall, and F1 score values of 94.57%, 96.33%, and 95.62%, respectively. Vision Transformer excelled with an accuracy of 97.64%, showcasing precision, recall, and F1 score values of 96.68%, 97.65%, and 97.56%, respectively. Notably, the proposed Hybrid Transformer model outperformed all other models, achieving outstanding accuracy of 99.83%, with precision, recall, and F1 score values of 99.47%, 99.79%, and 99.67%, respectively, showcasing its effectiveness in calorie estimation tasks. Figure 7 depicts the comparison of classification models with the proposed Hybrid Transformer model for calorie estimation.
Fig. 7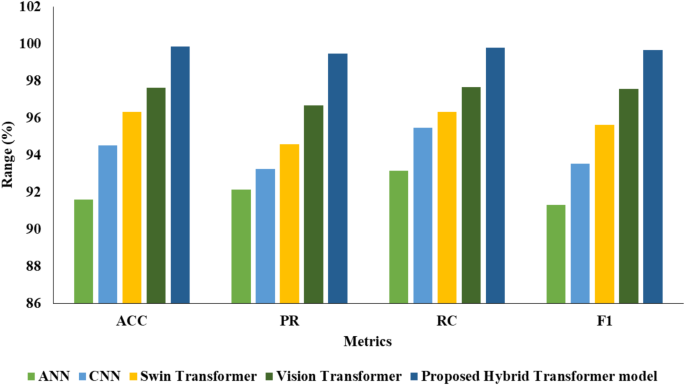
Classification models comparison with proposed Hybrid Transformer model of calorie estimation.
Optimization validation
Table 5 presents the comparison table of suggested IDBA model with other existing optimization models.
Table 5 Optimization validation of IDBA with other models.
In Table 5, regarding validation metrics, an analysis is provided contrasting the suggested IDBA model with other current optimization models. Accuracy (ACC), recall (RC), precision (PR), and F1-score (F1) are among the metrics that are assessed. The Hybrid Transformer-GOA (Grasshopper Optimization Algorithm) achieved an accuracy of 97.91%, with precision, recall, and F1 values of 97.94%, 97.67%, and 97.53%, respectively. The Hybrid Transformer-SMO (Spider Monkey Optimization) demonstrated improved performance, attaining an accuracy of 98.47%, along with PR, RC, and F1 values of 97.69%, 98.67%, and 98.22%, respectively. The Hybrid Transformer-ZOA (Zebra Optimization Algorithm) further enhanced the results, achieving an accuracy of 98.70%, with precision, recall, and F1 values of 98.40%, 98.68%, and 98.66%, respectively. Similarly, the Hybrid Transformer-BOA (Bat Optimization Algorithm) exhibited competitive performance, with an accuracy of 97.92%, precision of 98.68%, recall of 98.21%, and F1 of 98.79%. Notably, the proposed Hybrid Transformer-IDBA (Improved Discrete Bat Algorithm) outperformed all other models, achieving exceptional accuracy of 99.77%, precision of 99.31%, recall of 99.24%, and F1 of 99.43%, showcasing its effectiveness in optimization tasks. Figure 8 illustrates the optimization analysis of IDBA with other models.
Fig. 8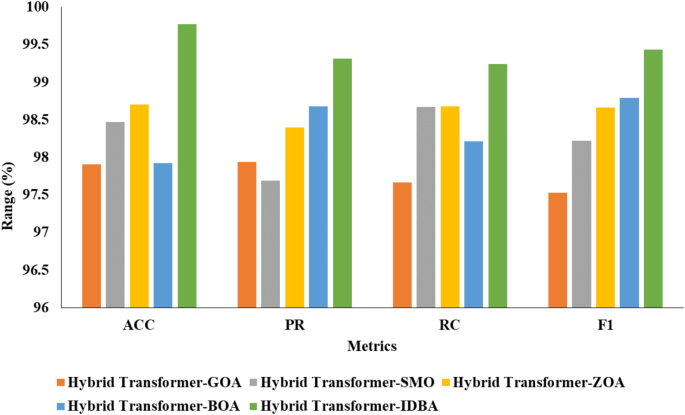
Optimization analysis of IDBA with various models.
Discussion
The results demonstrate the superior performance of the proposed hybrid transformer model, achieving a classification accuracy of 99.83% and outperforming state-of-the-art methods, including CNNs, Vision Transformers, and Swin Transformers. This improvement is attributed to the integration of global and local feature extraction capabilities, as supported by recent advancements in transformer-based architectures29,36. The use of Mutually Guided Image Filtering (MuGIF) significantly enhanced image quality, reducing noise and improving feature extraction consistency, consistent with findings in recent studies34,35.
Furthermore, hyperparameter optimization using the Improved Discrete Bat Algorithm (IDBA) played a critical role in fine-tuning the model parameters, yielding higher accuracy and robustness compared to other optimization techniques, as highlighted in related works37. The exceptional performance of the hybrid model across diverse food classes aligns with recent advancements in dietary monitoring systems, such as those reported in studies utilizing Vision Transformers for complex visual tasks.
These findings validate the efficacy of the proposed approach and highlight its potential for real-world applications in automated food recognition and calorie estimation. Future work will focus on expanding dataset diversity and implementing real-time capabilities to enhance model scalability and generalization.
Limitations
Despite the advancements in food recognition using deep learning (DL) techniques, several limitations persist. One major challenge is the variability in food presentation, such as differences in color, texture, and shape among various food items, which complicates the classification process. Environmental factors like lighting and camera angles can introduce noise and irregularities in food images, affecting the performance of classification models. Additionally, the scarcity of large-scale, well-annotated datasets hampers the training of robust DL models, leading to scalability and generalization issues. Another significant limitation is the difficulty in distinguishing between foods with similar appearances but different nutritional values, which is crucial for accurate dietary monitoring and calorie estimation. Furthermore, while various DL architectures have been proposed, there is insufficient research comparing their effectiveness in real-world settings, particularly in complex meal scenarios and diverse environmental conditions. To address these issues, more extensive datasets, sophisticated preprocessing techniques, and robust feature extraction methods are necessary.