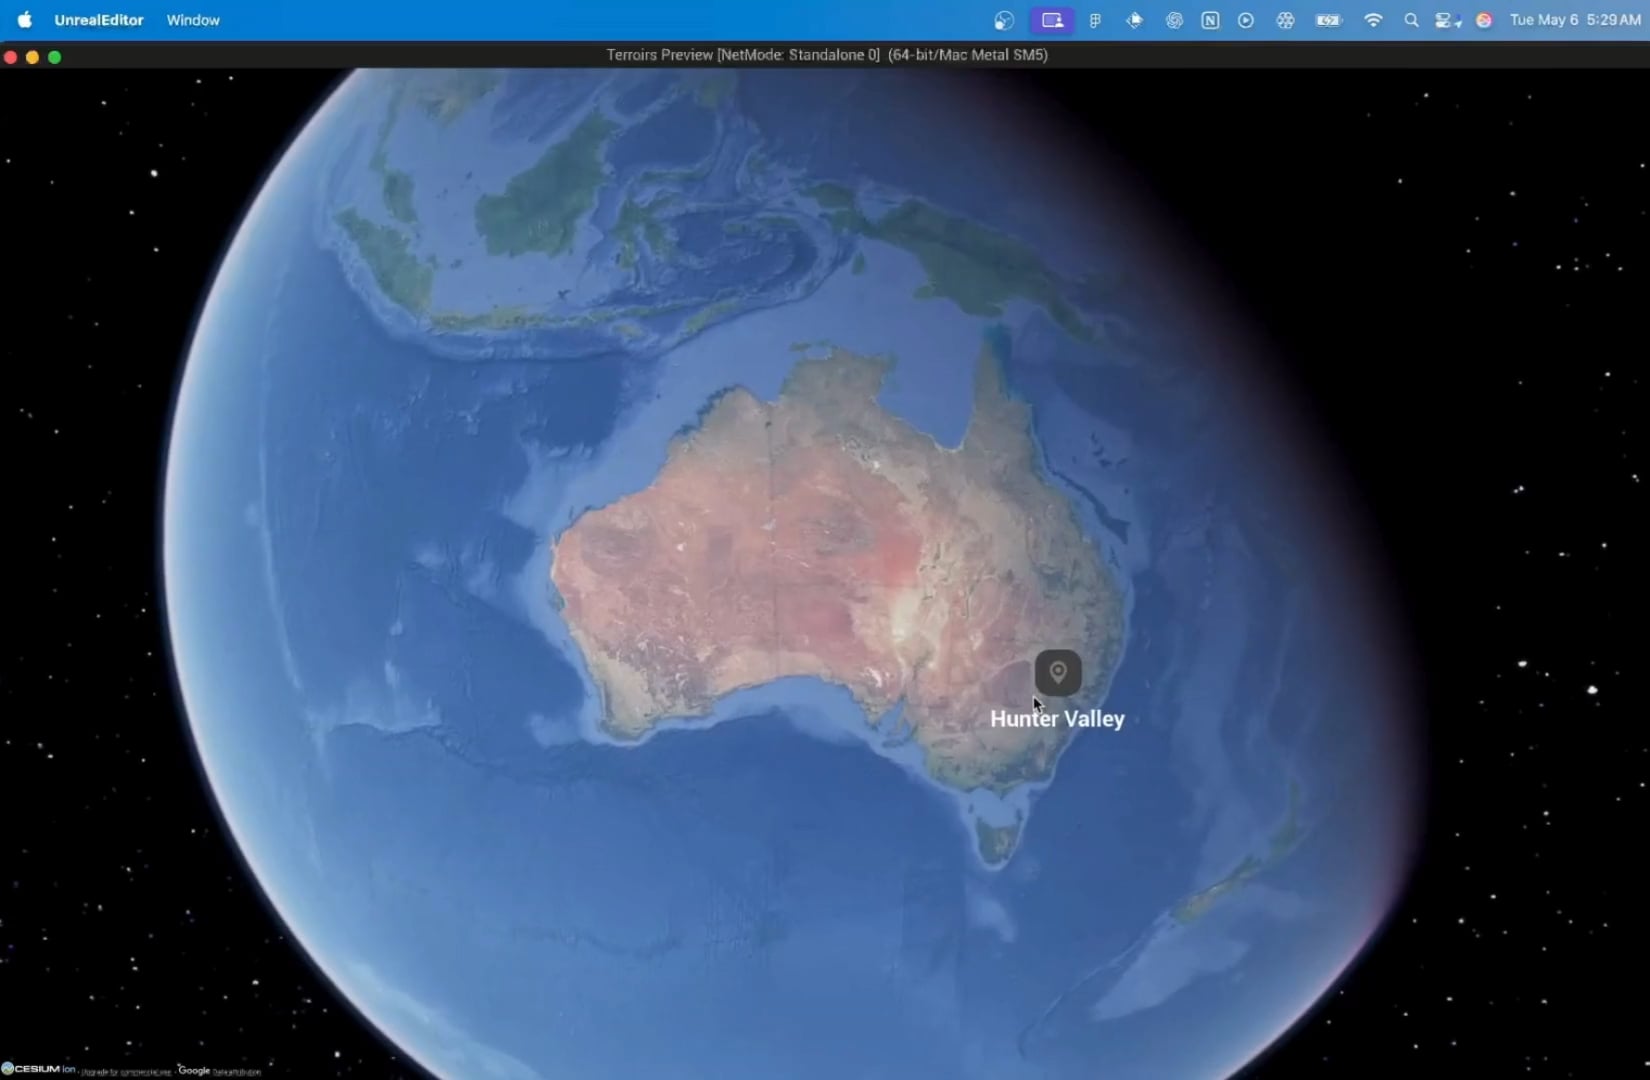
This new section gives users a seasonal breakdown of each wine region’s climate—because understanding when things happen is just as important as where they happen in wine. The Climate tab for Hunter Valley is ready, once I build the rest of the tabs I'll test out the flow and based on feedback tweak it and replicate it for the rest of the regions.
I’ve also added a Notes feature that highlights the influential landmarks. Think rivers, mountains, ocean currents that shape each region’s growing conditions.
Soon, these notes will be hooked up to location data, so you’ll be able to explore the landmarks interactively and see exactly how they affect winegrowing.
This is the kind of stuff I dreamed about as a student—visual, intuitive, and memorable.
by dionysusdesign

