

May 6, 2025
IndexBox has just published a new report: Middle East – Olive Oil And Its Fractions – Market Analysis, Forecast, Size, Trends And Insights.
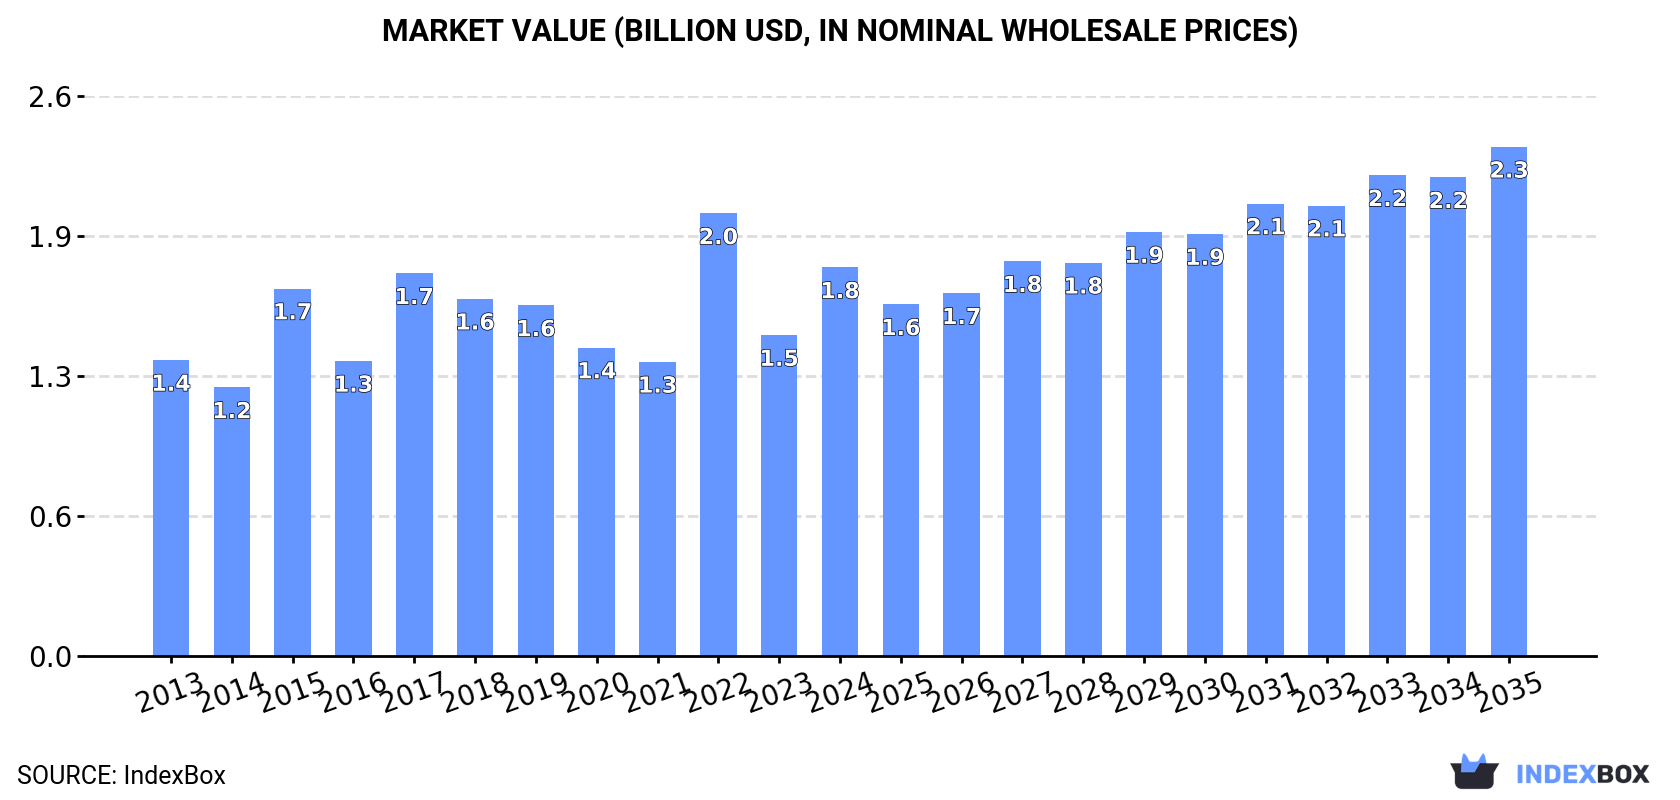
The Middle East olive oil market is expected to see a steady increase in consumption, with a forecasted growth rate of +2.5% in both volume and value from 2024 to 2035. By the end of 2035, the market volume is expected to reach 632K tons, with a market value of $2.3B in nominal prices.
Market Forecast
Driven by increasing demand for olive oil and its fractions in the Middle East, the market is expected to continue an upward consumption trend over the next decade. Market performance is forecast to retain its current trend pattern, expanding with an anticipated CAGR of +2.5% for the period from 2024 to 2035, which is projected to bring the market volume to 632K tons by the end of 2035.
In value terms, the market is forecast to increase with an anticipated CAGR of +2.5% for the period from 2024 to 2035, which is projected to bring the market value to $2.3B (in nominal wholesale prices) by the end of 2035.
 ConsumptionMiddle East’s Consumption of Olive Oil And Its Fractions
In 2024, approx. 484K tons of olive oil and its fractions were consumed in the Middle East; picking up by 21% compared with 2023 figures. The total consumption volume increased at an average annual rate of +1.8% from 2013 to 2024; however, the trend pattern indicated some noticeable fluctuations being recorded throughout the analyzed period. As a result, consumption attained the peak volume of 560K tons. From 2023 to 2024, the growth of the consumption remained at a somewhat lower figure.
The size of the olive oil market in the Middle East soared to $1.8B in 2024, with an increase of 21% against the previous year. This figure reflects the total revenues of producers and importers (excluding logistics costs, retail marketing costs, and retailers’ margins, which will be included in the final consumer price). The market value increased at an average annual rate of +2.5% from 2013 to 2024; however, the trend pattern indicated some noticeable fluctuations being recorded throughout the analyzed period. As a result, consumption attained the peak level of $2B. From 2023 to 2024, the growth of the market remained at a lower figure.
Consumption By Country
The country with the largest volume of olive oil consumption was Turkey (258K tons), accounting for 53% of total volume. Moreover, olive oil consumption in Turkey exceeded the figures recorded by the second-largest consumer, Syrian Arab Republic (100K tons), threefold. The third position in this ranking was taken by Israel (26K tons), with a 5.4% share.
In Turkey, olive oil consumption increased at an average annual rate of +5.3% over the period from 2013-2024. The remaining consuming countries recorded the following average annual rates of consumption growth: Syrian Arab Republic (-3.1% per year) and Israel (+4.4% per year).
In value terms, Turkey ($934M) led the market, alone. The second position in the ranking was held by Syrian Arab Republic ($293M). It was followed by Israel.
In Turkey, the olive oil market increased at an average annual rate of +5.6% over the period from 2013-2024. The remaining consuming countries recorded the following average annual rates of market growth: Syrian Arab Republic (-2.6% per year) and Israel (+4.9% per year).
The countries with the highest levels of olive oil per capita consumption in 2024 were Syrian Arab Republic (4.6 kg per person), Palestine (3.9 kg per person) and Turkey (3 kg per person).
From 2013 to 2024, the most notable rate of growth in terms of consumption, amongst the main consuming countries, was attained by Turkey (with a CAGR of +4.1%), while consumption for the other leaders experienced more modest paces of growth.
ProductionMiddle East’s Production of Olive Oil And Its Fractions
In 2024, the amount of olive oil and its fractions produced in the Middle East expanded remarkably to 549K tons, with an increase of 9.7% compared with 2023 figures. The total production indicated a perceptible increase from 2013 to 2024: its volume increased at an average annual rate of +2.3% over the last eleven-year period. The trend pattern, however, indicated some noticeable fluctuations being recorded throughout the analyzed period. Based on 2024 figures, production decreased by -8.1% against 2022 indices. The most prominent rate of growth was recorded in 2022 when the production volume increased by 48% against the previous year. As a result, production reached the peak volume of 597K tons. From 2023 to 2024, production growth remained at a lower figure.
In value terms, olive oil production expanded remarkably to $1.9B in 2024 estimated in export price. The total production indicated a perceptible increase from 2013 to 2024: its value increased at an average annual rate of +2.7% over the last eleven years. The trend pattern, however, indicated some noticeable fluctuations being recorded throughout the analyzed period. Based on 2024 figures, production decreased by -9.4% against 2022 indices. The pace of growth was the most pronounced in 2022 with an increase of 60% against the previous year. As a result, production reached the peak level of $2.1B. From 2023 to 2024, production growth failed to regain momentum.
Production By Country
The countries with the highest volumes of production in 2024 were Turkey (282K tons), Syrian Arab Republic (168K tons) and Palestine (31K tons), together accounting for 88% of total production.
From 2013 to 2024, the most notable rate of growth in terms of production, amongst the main producing countries, was attained by Palestine (with a CAGR of +5.4%), while production for the other leaders experienced more modest paces of growth.
ImportsMiddle East’s Imports of Olive Oil And Its Fractions
In 2024, olive oil imports in the Middle East reduced slightly to 98K tons, with a decrease of -2.9% compared with 2023. Overall, imports, however, enjoyed buoyant growth. The most prominent rate of growth was recorded in 2019 with an increase of 37%. Over the period under review, imports reached the maximum at 116K tons in 2020; however, from 2021 to 2024, imports remained at a lower figure.
In value terms, olive oil imports skyrocketed to $589M in 2024. In general, imports, however, continue to indicate a buoyant increase. The pace of growth appeared the most rapid in 2018 when imports increased by 39% against the previous year. Over the period under review, imports attained the maximum in 2024 and are expected to retain growth in the near future.
Imports By Country
In 2024, Turkey (51K tons) was the key importer of olive oil and its fractions, achieving 52% of total imports. Saudi Arabia (18K tons) held the second position in the ranking, followed by Israel (13K tons) and the United Arab Emirates (7.3K tons). All these countries together took approx. 39% share of total imports. Qatar (2.8K tons) took a minor share of total imports.
Turkey was also the fastest-growing in terms of the olive oil and its fractions imports, with a CAGR of +64.5% from 2013 to 2024. At the same time, Israel (+15.2%), Qatar (+6.1%), the United Arab Emirates (+4.8%) and Saudi Arabia (+1.7%) displayed positive paces of growth. From 2013 to 2024, the share of Turkey and Israel increased by +51 and +5.9 percentage points, respectively. The shares of the other countries remained relatively stable throughout the analyzed period.
In value terms, Turkey ($303M) constitutes the largest market for imported olive oil and its fractions in the Middle East, comprising 52% of total imports. The second position in the ranking was held by Saudi Arabia ($111M), with a 19% share of total imports. It was followed by Israel, with a 17% share.
In Turkey, olive oil imports expanded at an average annual rate of +71.8% over the period from 2013-2024. In the other countries, the average annual rates were as follows: Saudi Arabia (+8.7% per year) and Israel (+21.7% per year).
Import Prices By Country
In 2024, the import price in the Middle East amounted to $6,017 per ton, surging by 43% against the previous year. Import price indicated a strong increase from 2013 to 2024: its price increased at an average annual rate of +5.6% over the last eleven years. The trend pattern, however, indicated some noticeable fluctuations being recorded throughout the analyzed period. Based on 2024 figures, olive oil import price increased by +130.3% against 2020 indices. As a result, import price reached the peak level and is likely to continue growth in the immediate term.
Average prices varied somewhat amongst the major importing countries. In 2024, major importing countries recorded the following prices: in Israel ($7,449 per ton) and Saudi Arabia ($6,209 per ton), while the United Arab Emirates ($5,002 per ton) and Qatar ($5,864 per ton) were amongst the lowest.
From 2013 to 2024, the most notable rate of growth in terms of prices was attained by Saudi Arabia (+6.9%), while the other leaders experienced more modest paces of growth.
ExportsMiddle East’s Exports of Olive Oil And Its Fractions
After two years of growth, shipments abroad of olive oil and its fractions decreased by -19.6% to 163K tons in 2024. Overall, exports, however, posted a resilient expansion. The most prominent rate of growth was recorded in 2016 with an increase of 79% against the previous year. The volume of export peaked at 203K tons in 2023, and then dropped dramatically in the following year.
In value terms, olive oil exports dropped to $830M in 2024. In general, exports, however, recorded a strong expansion. The most prominent rate of growth was recorded in 2023 when exports increased by 86% against the previous year. As a result, the exports attained the peak of $895M, and then declined in the following year.
Exports By Country
Turkey (75K tons) and Syrian Arab Republic (68K tons) dominates exports structure, together mixing up 88% of total exports. It was distantly followed by Palestine (9.6K tons), achieving a 5.9% share of total exports. Lebanon (4.4K tons) followed a long way behind the leaders.
From 2013 to 2024, the biggest increases were recorded for Palestine (with a CAGR of +14.3%), while shipments for the other leaders experienced more modest paces of growth.
In value terms, Turkey ($511M) remains the largest olive oil supplier in the Middle East, comprising 62% of total exports. The second position in the ranking was held by Syrian Arab Republic ($231M), with a 28% share of total exports. It was followed by Palestine, with a 5% share.
From 2013 to 2024, the average annual rate of growth in terms of value in Turkey stood at +12.4%. In the other countries, the average annual rates were as follows: Syrian Arab Republic (+15.4% per year) and Palestine (+15.2% per year).
Export Prices By Country
In 2024, the export price in the Middle East amounted to $5,092 per ton, with an increase of 15% against the previous year. Export price indicated a noticeable expansion from 2013 to 2024: its price increased at an average annual rate of +4.4% over the last eleven-year period. The trend pattern, however, indicated some noticeable fluctuations being recorded throughout the analyzed period. Based on 2024 figures, olive oil export price increased by +110.9% against 2020 indices. The most prominent rate of growth was recorded in 2023 an increase of 30%. Over the period under review, the export prices reached the maximum in 2024 and is likely to continue growth in years to come.
Prices varied noticeably by country of origin: amid the top suppliers, the country with the highest price was Turkey ($6,823 per ton), while Syrian Arab Republic ($3,387 per ton) was amongst the lowest.
From 2013 to 2024, the most notable rate of growth in terms of prices was attained by Turkey (+6.7%), while the other leaders experienced more modest paces of growth.
Source: IndexBox Market Intelligence Platform