

May 7, 2025
IndexBox has just published a new report: Africa – Refined Olive Oil – Market Analysis, Forecast, Size, Trends And Insights.
Driven by increasing demand, the African market for refined olive oil is set to see steady growth in the coming years. With a projected CAGR of +1.4% in volume and +2.0% in value from 2024 to 2035, this market is poised for a promising future.
Market Forecast
Driven by increasing demand for refined olive oil in Africa, the market is expected to continue an upward consumption trend over the next decade. Market performance is forecast to decelerate, expanding with an anticipated CAGR of +1.4% for the period from 2024 to 2035, which is projected to bring the market volume to 1.7M tons by the end of 2035.
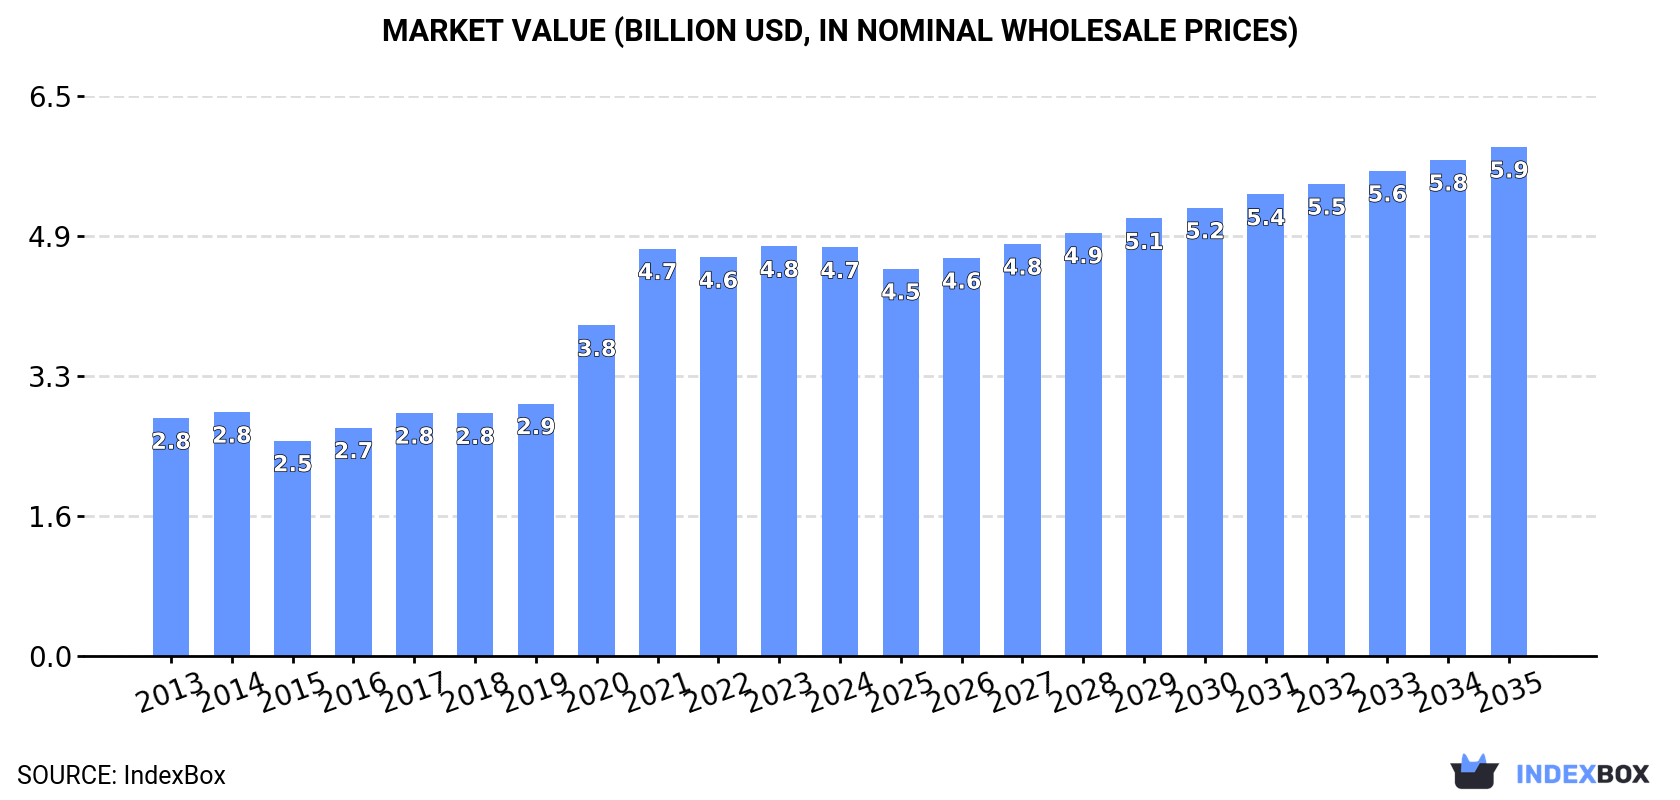
In value terms, the market is forecast to increase with an anticipated CAGR of +2.0% for the period from 2024 to 2035, which is projected to bring the market value to $5.9B (in nominal wholesale prices) by the end of 2035.
 ConsumptionAfrica’s Consumption of Refined Olive Oil
In 2024, the amount of refined olive oil consumed in Africa fell modestly to 1.5M tons, remaining constant against the year before. The total consumption indicated measured growth from 2013 to 2024: its volume increased at an average annual rate of +3.7% over the last eleven-year period. The trend pattern, however, indicated some noticeable fluctuations being recorded throughout the analyzed period. Based on 2024 figures, consumption decreased by -0.3% against 2021 indices. As a result, consumption reached the peak volume of 1.5M tons; afterwards, it flattened through to 2024.
The value of the refined olive oil market in Africa shrank slightly to $4.7B in 2024, almost unchanged from the previous year. This figure reflects the total revenues of producers and importers (excluding logistics costs, retail marketing costs, and retailers’ margins, which will be included in the final consumer price). In general, consumption, however, recorded a strong expansion. The level of consumption peaked at $4.8B in 2023, and then fell slightly in the following year.
Consumption By Country
The countries with the highest volumes of consumption in 2024 were Nigeria (250K tons), Ethiopia (158K tons) and Democratic Republic of the Congo (123K tons), together accounting for 36% of total consumption. Tanzania, Egypt, Uganda, South Africa, Sudan, Algeria and Mozambique lagged somewhat behind, together accounting for a further 28%.
From 2013 to 2024, the most notable rate of growth in terms of consumption, amongst the main consuming countries, was attained by Sudan (with a CAGR of +11.5%), while consumption for the other leaders experienced more modest paces of growth.
In value terms, the largest refined olive oil markets in Africa were Nigeria ($774M), Ethiopia ($507M) and Democratic Republic of the Congo ($348M), with a combined 34% share of the total market. Egypt, Tanzania, Sudan, South Africa, Algeria, Mozambique and Uganda lagged somewhat behind, together comprising a further 28%.
Sudan, with a CAGR of +16.9%, saw the highest growth rate of market size in terms of the main consuming countries over the period under review, while market for the other leaders experienced more modest paces of growth.
The countries with the highest levels of refined olive oil per capita consumption in 2024 were Ethiopia (1.2 kg per person), Tanzania (1.2 kg per person) and Democratic Republic of the Congo (1.2 kg per person).
From 2013 to 2024, the most notable rate of growth in terms of consumption, amongst the main consuming countries, was attained by Sudan (with a CAGR of +8.9%), while consumption for the other leaders experienced more modest paces of growth.
ProductionAfrica’s Production of Refined Olive Oil
In 2024, the amount of refined olive oil produced in Africa reduced modestly to 1.5M tons, remaining relatively unchanged against 2023. The total production indicated a measured increase from 2013 to 2024: its volume increased at an average annual rate of +3.8% over the last eleven-year period. The trend pattern, however, indicated some noticeable fluctuations being recorded throughout the analyzed period. Based on 2024 figures, production decreased by -0.5% against 2021 indices. The growth pace was the most rapid in 2021 with an increase of 24% against the previous year. As a result, production attained the peak volume of 1.5M tons; afterwards, it flattened through to 2024.
In value terms, refined olive oil production contracted to $4.8B in 2024 estimated in export price. Overall, production, however, continues to indicate a resilient expansion. The most prominent rate of growth was recorded in 2020 with an increase of 39% against the previous year. Over the period under review, production reached the peak level at $4.9B in 2021; however, from 2022 to 2024, production failed to regain momentum.
Production By Country
The countries with the highest volumes of production in 2024 were Nigeria (250K tons), Ethiopia (158K tons) and Democratic Republic of the Congo (123K tons), together accounting for 36% of total production. Tanzania, Egypt, South Africa, Uganda, Sudan, Algeria and Mozambique lagged somewhat behind, together accounting for a further 28%.
From 2013 to 2024, the biggest increases were recorded for Sudan (with a CAGR of +11.5%), while production for the other leaders experienced more modest paces of growth.
ImportsAfrica’s Imports of Refined Olive Oil
In 2024, imports of refined olive oil in Africa contracted to 13K tons, falling by -9.2% against the year before. In general, imports continue to indicate a deep setback. The most prominent rate of growth was recorded in 2022 with an increase of 23% against the previous year. Over the period under review, imports reached the maximum at 28K tons in 2016; however, from 2017 to 2024, imports failed to regain momentum.
In value terms, refined olive oil imports reduced to $63M in 2024. Overall, imports continue to indicate a relatively flat trend pattern. The growth pace was the most rapid in 2022 with an increase of 55% against the previous year. The level of import peaked at $72M in 2016; however, from 2017 to 2024, imports stood at a somewhat lower figure.
Imports By Country
Morocco was the key importing country with an import of about 3.9K tons, which recorded 29% of total imports. Seychelles (1.4K tons) ranks second in terms of the total imports with a 10% share, followed by Cabo Verde (10%), Ghana (7.9%) and Angola (4.8%). Tanzania (563 tons), Mozambique (352 tons), Cote d’Ivoire (319 tons), Mauritius (298 tons) and Nigeria (285 tons) held a relatively small share of total imports.
Morocco experienced a relatively flat trend pattern with regard to volume of imports of refined olive oil. At the same time, Tanzania (+10.7%), Ghana (+7.0%) and Cabo Verde (+3.6%) displayed positive paces of growth. Moreover, Tanzania emerged as the fastest-growing importer imported in Africa, with a CAGR of +10.7% from 2013-2024. Mauritius experienced a relatively flat trend pattern. By contrast, Nigeria (-3.7%), Seychelles (-3.9%), Mozambique (-8.7%), Cote d’Ivoire (-16.2%) and Angola (-21.7%) illustrated a downward trend over the same period. From 2013 to 2024, the share of Morocco, Cabo Verde, Ghana, Tanzania and Seychelles increased by +12, +6.5, +5.9, +3.5 and +1.8 percentage points, respectively. The shares of the other countries remained relatively stable throughout the analyzed period.
In value terms, Morocco ($25M) constitutes the largest market for imported refined olive oil in Africa, comprising 40% of total imports. The second position in the ranking was held by Cabo Verde ($6.1M), with a 9.8% share of total imports. It was followed by Seychelles, with a 9.7% share.
In Morocco, refined olive oil imports expanded at an average annual rate of +4.7% over the period from 2013-2024. The remaining importing countries recorded the following average annual rates of imports growth: Cabo Verde (+4.6% per year) and Seychelles (-1.5% per year).
Import Prices By Country
In 2024, the import price in Africa amounted to $4,703 per ton, leveling off at the previous year. In general, the import price, however, saw prominent growth. The pace of growth was the most pronounced in 2023 an increase of 35% against the previous year. As a result, import price reached the peak level of $4,738 per ton, leveling off in the following year.
There were significant differences in the average prices amongst the major importing countries. In 2024, amid the top importers, the country with the highest price was Mauritius ($8,090 per ton), while Tanzania ($835 per ton) was amongst the lowest.
From 2013 to 2024, the most notable rate of growth in terms of prices was attained by Angola (+11.7%), while the other leaders experienced more modest paces of growth.
ExportsAfrica’s Exports of Refined Olive Oil
In 2024, refined olive oil exports in Africa declined to 13K tons, waning by -11.3% against 2023 figures. Overall, exports, however, continue to indicate a temperate expansion. The pace of growth was the most pronounced in 2020 with an increase of 135%. As a result, the exports reached the peak of 38K tons. From 2021 to 2024, the growth of the exports remained at a lower figure.
In value terms, refined olive oil exports declined sharply to $63M in 2024. Over the period under review, exports, however, continue to indicate a remarkable increase. The most prominent rate of growth was recorded in 2020 when exports increased by 114%. As a result, the exports reached the peak of $97M. From 2021 to 2024, the growth of the exports failed to regain momentum.
Exports By Country
Tunisia prevails in exports structure, resulting at 12K tons, which was approx. 92% of total exports in 2024. It was distantly followed by South Africa (611 tons), making up a 4.8% share of total exports.
Tunisia was also the fastest-growing in terms of the refined olive oil exports, with a CAGR of +5.0% from 2013 to 2024. At the same time, South Africa (+4.3%) displayed positive paces of growth. Tunisia (+25 p.p.) significantly strengthened its position in terms of the total exports, while the shares of the other countries remained relatively stable throughout the analyzed period.
In value terms, Tunisia ($57M) remains the largest refined olive oil supplier in Africa, comprising 91% of total exports. The second position in the ranking was held by South Africa ($2.8M), with a 4.6% share of total exports.
From 2013 to 2024, the average annual growth rate of value in Tunisia totaled +8.8%.
Export Prices By Country
In 2024, the export price in Africa amounted to $4,949 per ton, shrinking by -15.8% against the previous year. Over the period under review, the export price, however, showed a noticeable increase. The pace of growth appeared the most rapid in 2023 an increase of 66%. As a result, the export price reached the peak level of $5,875 per ton, and then shrank sharply in the following year.
Average prices varied noticeably amongst the major exporting countries. In 2024, amid the top suppliers, the country with the highest price was Tunisia ($4,937 per ton), while South Africa totaled $4,663 per ton.
From 2013 to 2024, the most notable rate of growth in terms of prices was attained by South Africa (+3.7%).
Source: IndexBox Market Intelligence Platform