

May 12, 2025
IndexBox has just published a new report: Africa – Olive Oil And Its Fractions – Market Analysis, Forecast, Size, Trends And Insights.
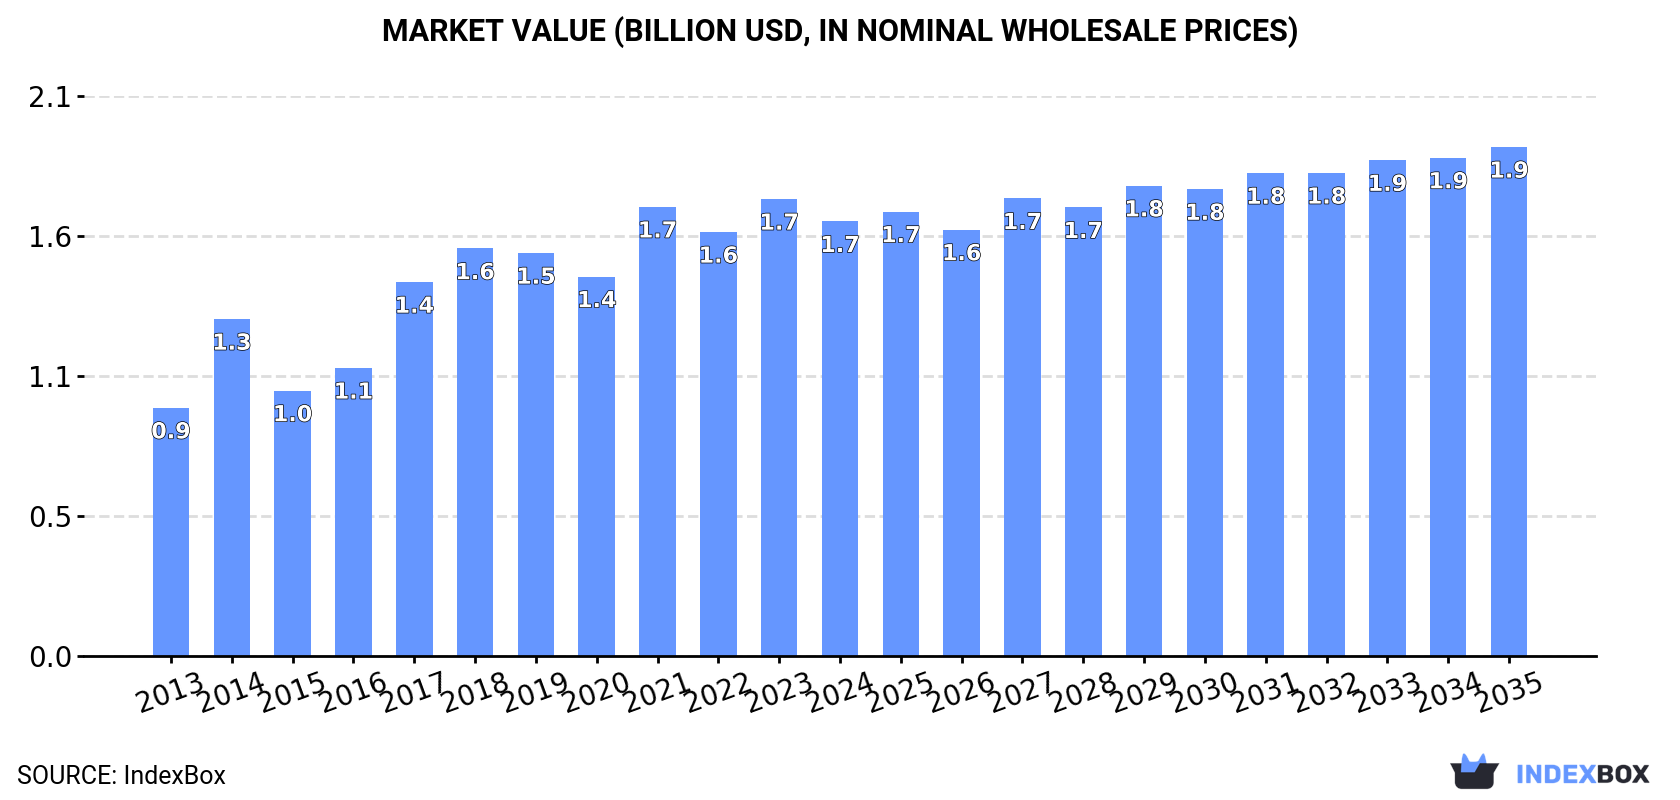
The article discusses the rising demand for olive oil in Africa, projecting a modest growth in market performance with a +0.2% CAGR for volume and +1.4% CAGR for value from 2024 to 2035. This growth trend is expected to continue as consumption of olive oil in the region shows steady increase.
Market Forecast
Driven by increasing demand for olive oil and its fractions in Africa, the market is expected to continue an upward consumption trend over the next decade. Market performance is forecast to decelerate, expanding with an anticipated CAGR of +0.2% for the period from 2024 to 2035, which is projected to bring the market volume to 433K tons by the end of 2035.
In value terms, the market is forecast to increase with an anticipated CAGR of +1.4% for the period from 2024 to 2035, which is projected to bring the market value to $1.9B (in nominal wholesale prices) by the end of 2035.
 ConsumptionAfrica’s Consumption of Olive Oil And Its Fractions
In 2024, the amount of olive oil and its fractions consumed in Africa shrank slightly to 422K tons, waning by -3.9% on the previous year. The total consumption indicated a noticeable increase from 2013 to 2024: its volume increased at an average annual rate of +4.5% over the last eleven-year period. The trend pattern, however, indicated some noticeable fluctuations being recorded throughout the analyzed period. Based on 2024 figures, consumption increased by +1.4% against 2022 indices. Over the period under review, consumption reached the peak volume at 456K tons in 2019; however, from 2020 to 2024, consumption stood at a somewhat lower figure.
The value of the olive oil market in Africa dropped slightly to $1.7B in 2024, with a decrease of -4.9% against the previous year. This figure reflects the total revenues of producers and importers (excluding logistics costs, retail marketing costs, and retailers’ margins, which will be included in the final consumer price). The total consumption indicated a buoyant increase from 2013 to 2024: its value increased at an average annual rate of +5.2% over the last eleven-year period. The trend pattern, however, indicated some noticeable fluctuations being recorded throughout the analyzed period. Based on 2024 figures, consumption increased by +14.5% against 2020 indices. The level of consumption peaked at $1.7B in 2023, and then shrank slightly in the following year.
Consumption By Country
The countries with the highest volumes of consumption in 2024 were Morocco (180K tons), Tunisia (91K tons) and Algeria (84K tons), with a combined 84% share of total consumption. Egypt and Libya lagged somewhat behind, together accounting for a further 14%.
From 2013 to 2024, the most notable rate of growth in terms of consumption, amongst the leading consuming countries, was attained by Egypt (with a CAGR of +13.2%), while consumption for the other leaders experienced more modest paces of growth.
In value terms, the largest olive oil markets in Africa were Morocco ($708M), Tunisia ($359M) and Algeria ($326M), together accounting for 84% of the total market. Egypt and Libya lagged somewhat behind, together accounting for a further 13%.
Among the main consuming countries, Egypt, with a CAGR of +16.0%, recorded the highest rates of growth with regard to market size over the period under review, while market for the other leaders experienced more modest paces of growth.
The countries with the highest levels of olive oil per capita consumption in 2024 were Tunisia (7.5 kg per person), Morocco (4.7 kg per person) and Libya (2.4 kg per person).
From 2013 to 2024, the biggest increases were recorded for Egypt (with a CAGR of +10.9%), while consumption for the other leaders experienced more modest paces of growth.
ProductionAfrica’s Production of Olive Oil And Its Fractions
In 2024, the amount of olive oil and its fractions produced in Africa declined modestly to 573K tons, remaining relatively unchanged against the year before. The total production indicated notable growth from 2013 to 2024: its volume increased at an average annual rate of +3.5% over the last eleven-year period. The trend pattern, however, indicated some noticeable fluctuations being recorded throughout the analyzed period. Based on 2024 figures, production decreased by +0.6% against 2022 indices. The most prominent rate of growth was recorded in 2018 with an increase of 37% against the previous year. The volume of production peaked at 779K tons in 2020; however, from 2021 to 2024, production remained at a lower figure.
In value terms, olive oil production contracted modestly to $2.3B in 2024 estimated in export price. The total production indicated tangible growth from 2013 to 2024: its value increased at an average annual rate of +4.6% over the last eleven years. The trend pattern, however, indicated some noticeable fluctuations being recorded throughout the analyzed period. Based on 2024 figures, production decreased by +0.1% against 2022 indices. The pace of growth appeared the most rapid in 2015 with an increase of 32%. Over the period under review, production reached the peak level at $2.3B in 2020; afterwards, it flattened through to 2024.
Production By Country
The countries with the highest volumes of production in 2024 were Tunisia (240K tons), Morocco (185K tons) and Algeria (84K tons), together accounting for 89% of total production. Egypt and Libya lagged somewhat behind, together comprising a further 11%.
From 2013 to 2024, the biggest increases were recorded for Egypt (with a CAGR of +13.7%), while production for the other leaders experienced more modest paces of growth.
ImportsAfrica’s Imports of Olive Oil And Its Fractions
In 2024, purchases abroad of olive oil and its fractions decreased by -17% to 14K tons, falling for the third year in a row after two years of growth. Overall, imports saw a perceptible shrinkage. The pace of growth was the most pronounced in 2018 with an increase of 76% against the previous year. As a result, imports reached the peak of 32K tons. From 2019 to 2024, the growth of imports remained at a lower figure.
In value terms, olive oil imports declined to $81M in 2024. Total imports indicated a perceptible expansion from 2013 to 2024: its value increased at an average annual rate of +2.3% over the last eleven years. The trend pattern, however, indicated some noticeable fluctuations being recorded throughout the analyzed period. Based on 2024 figures, imports increased by +58.6% against 2019 indices. The most prominent rate of growth was recorded in 2016 when imports increased by 27%. The level of import peaked at $86M in 2023, and then dropped in the following year.
Imports By Country
Morocco represented the largest importing country with an import of around 3.5K tons, which finished at 25% of total imports. South Africa (1,223 tons) held the second position in the ranking, followed by Kenya (864 tons), Ethiopia (770 tons), Seychelles (692 tons) and Cabo Verde (686 tons). All these countries together took approx. 31% share of total imports. The following importers – Tunisia (570 tons), Mauritius (550 tons), Cote d’Ivoire (438 tons) and Angola (387 tons) – together made up 14% of total imports.
Imports into Morocco decreased at an average annual rate of -3.8% from 2013 to 2024. At the same time, Cabo Verde (+30.0%), Ethiopia (+21.3%), Cote d’Ivoire (+17.6%), Kenya (+7.5%) and Tunisia (+2.7%) displayed positive paces of growth. Moreover, Cabo Verde emerged as the fastest-growing importer imported in Africa, with a CAGR of +30.0% from 2013-2024. By contrast, Mauritius (-1.7%), Seychelles (-4.8%), South Africa (-6.8%) and Angola (-16.6%) illustrated a downward trend over the same period. While the share of Ethiopia (+5.1 p.p.), Cabo Verde (+4.8 p.p.), Kenya (+4.3 p.p.), Cote d’Ivoire (+2.8 p.p.) and Tunisia (+2 p.p.) increased significantly in terms of the total imports from 2013-2024, the share of Morocco (-1.8 p.p.), South Africa (-4.7 p.p.) and Angola (-11.7 p.p.) displayed negative dynamics. The shares of the other countries remained relatively stable throughout the analyzed period.
In value terms, Morocco ($25M) constitutes the largest market for imported olive oil and its fractions in Africa, comprising 31% of total imports. The second position in the ranking was held by South Africa ($11M), with a 13% share of total imports. It was followed by Kenya, with a 5.7% share.
In Morocco, olive oil imports expanded at an average annual rate of +3.7% over the period from 2013-2024. The remaining importing countries recorded the following average annual rates of imports growth: South Africa (-0.3% per year) and Kenya (+11.2% per year).
Import Prices By Country
The import price in Africa stood at $5,882 per ton in 2024, growing by 14% against the previous year. Overall, the import price continues to indicate resilient growth. The pace of growth appeared the most rapid in 2017 an increase of 47%. Over the period under review, import prices hit record highs in 2024 and is likely to continue growth in the near future.
Prices varied noticeably by country of destination: amid the top importers, the country with the highest price was South Africa ($8,958 per ton), while Tunisia ($2,427 per ton) was amongst the lowest.
From 2013 to 2024, the most notable rate of growth in terms of prices was attained by Angola (+7.9%), while the other leaders experienced more modest paces of growth.
ExportsAfrica’s Exports of Olive Oil And Its Fractions
In 2024, after three years of decline, there was significant growth in shipments abroad of olive oil and its fractions, when their volume increased by 7% to 164K tons. In general, exports saw a relatively flat trend pattern. The most prominent rate of growth was recorded in 2015 with an increase of 338%. The volume of export peaked at 370K tons in 2020; however, from 2021 to 2024, the exports remained at a lower figure.
In value terms, olive oil exports reduced slightly to $896M in 2024. Overall, exports saw a buoyant increase. The pace of growth was the most pronounced in 2015 when exports increased by 301% against the previous year. As a result, the exports attained the peak of $957M. From 2016 to 2024, the growth of the exports remained at a somewhat lower figure.
Exports By Country
Tunisia dominates exports structure, accounting for 149K tons, which was approx. 91% of total exports in 2024. It was distantly followed by Morocco (8K tons), creating a 4.9% share of total exports. Egypt (5.6K tons) followed a long way behind the leaders.
Tunisia experienced a relatively flat trend pattern with regard to volume of exports of olive oil and its fractions. At the same time, Egypt (+10.6%) and Morocco (+5.8%) displayed positive paces of growth. Moreover, Egypt emerged as the fastest-growing exporter exported in Africa, with a CAGR of +10.6% from 2013-2024. From 2013 to 2024, the share of Egypt and Morocco increased by +2.2 and +2 percentage points, respectively.
In value terms, Tunisia ($790M) remains the largest olive oil supplier in Africa, comprising 88% of total exports. The second position in the ranking was taken by Morocco ($65M), with a 7.2% share of total exports.
In Tunisia, olive oil exports expanded at an average annual rate of +4.6% over the period from 2013-2024. In the other countries, the average annual rates were as follows: Morocco (+13.1% per year) and Egypt (+21.3% per year).
Export Prices By Country
The export price in Africa stood at $5,461 per ton in 2024, declining by -10.1% against the previous year. Overall, the export price, however, showed a moderate increase. The most prominent rate of growth was recorded in 2021 when the export price increased by 53% against the previous year. Over the period under review, the export prices hit record highs at $6,077 per ton in 2023, and then fell in the following year.
Prices varied noticeably by country of origin: amid the top suppliers, the country with the highest price was Morocco ($8,044 per ton), while Tunisia ($5,303 per ton) was amongst the lowest.
From 2013 to 2024, the most notable rate of growth in terms of prices was attained by Egypt (+9.7%), while the other leaders experienced more modest paces of growth.
Source: IndexBox Market Intelligence Platform