

May 16, 2025
IndexBox has just published a new report: Northern America – Refined Olive Oil – Market Analysis, Forecast, Size, Trends And Insights.
Driven by rising demand, the market for refined olive oil in Northern America is anticipated to see steady growth, with a forecasted CAGR of +0.3% in volume and +0.5% in value from 2024 to 2035. This growth trend is expected to continue, showcasing a positive outlook for the industry.
Market Forecast
Driven by increasing demand for refined olive oil in Northern America, the market is expected to continue an upward consumption trend over the next decade. Market performance is forecast to decelerate, expanding with an anticipated CAGR of +0.3% for the period from 2024 to 2035, which is projected to bring the market volume to 790K tons by the end of 2035.
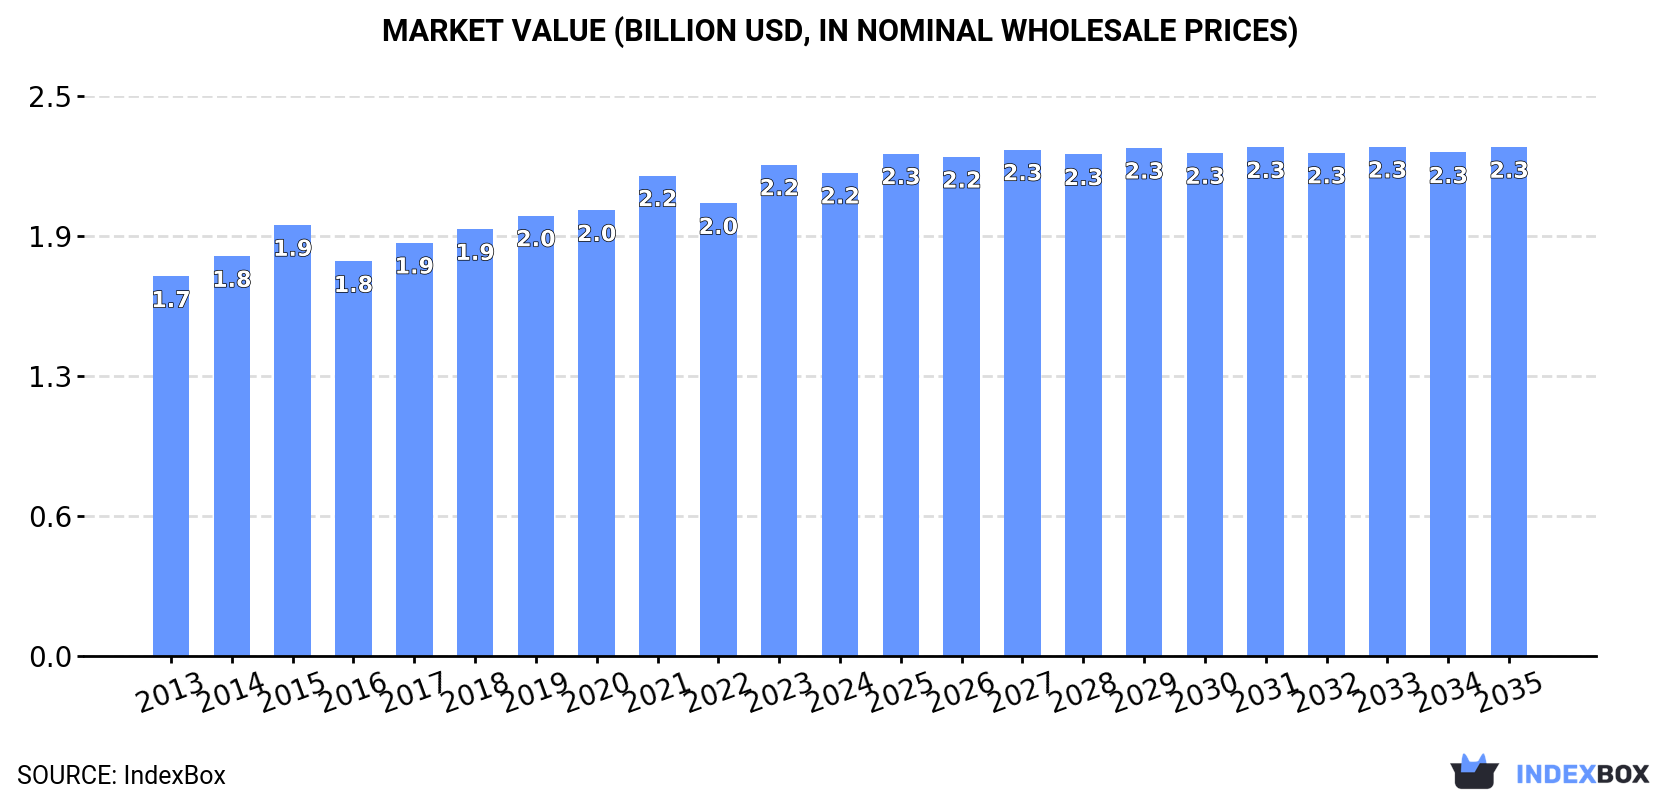
In value terms, the market is forecast to increase with an anticipated CAGR of +0.5% for the period from 2024 to 2035, which is projected to bring the market value to $2.3B (in nominal wholesale prices) by the end of 2035.
 ConsumptionNorthern America’s Consumption of Refined Olive Oil
In 2024, consumption of refined olive oil increased by 1.7% to 768K tons, rising for the fifth year in a row after two years of decline. The total consumption volume increased at an average annual rate of +1.3% over the period from 2013 to 2024; the trend pattern remained consistent, with somewhat noticeable fluctuations being recorded in certain years. The growth pace was the most rapid in 2021 with an increase of 5.6%. Over the period under review, consumption hit record highs in 2024 and is expected to retain growth in the immediate term.
The size of the refined olive oil market in Northern America reduced modestly to $2.2B in 2024, dropping by -1.7% against the previous year. This figure reflects the total revenues of producers and importers (excluding logistics costs, retail marketing costs, and retailers’ margins, which will be included in the final consumer price). The market value increased at an average annual rate of +2.2% from 2013 to 2024; the trend pattern remained consistent, with somewhat noticeable fluctuations being observed throughout the analyzed period. The most prominent rate of growth was recorded in 2023 when the market value increased by 8.5% against the previous year. As a result, consumption attained the peak level of $2.2B, and then fell slightly in the following year.
Consumption By Country
The United States (673K tons) remains the largest refined olive oil consuming country in Northern America, comprising approx. 88% of total volume. Moreover, refined olive oil consumption in the United States exceeded the figures recorded by the second-largest consumer, Canada (94K tons), sevenfold.
From 2013 to 2024, the average annual rate of growth in terms of volume in the United States totaled +1.4%.
In value terms, the United States ($1.9B) led the market, alone. The second position in the ranking was taken by Canada ($234M).
In the United States, the refined olive oil market expanded at an average annual rate of +2.6% over the period from 2013-2024.
The countries with the highest levels of refined olive oil per capita consumption in 2024 were Canada (2.4 kg per person) and the United States (2 kg per person).
From 2013 to 2024, the most notable rate of growth in terms of consumption, amongst the key consuming countries, was attained by the United States (with a CAGR of +0.8%).
ProductionNorthern America’s Production of Refined Olive Oil
Refined olive oil production expanded slightly to 685K tons in 2024, rising by 2.6% on 2023 figures. The total output volume increased at an average annual rate of +1.6% over the period from 2013 to 2024; the trend pattern remained relatively stable, with only minor fluctuations being recorded throughout the analyzed period. The most prominent rate of growth was recorded in 2021 with an increase of 9.1%. The volume of production peaked in 2024 and is expected to retain growth in the near future.
In value terms, refined olive oil production dropped to $1.9B in 2024 estimated in export price. The total output value increased at an average annual rate of +2.6% over the period from 2013 to 2024; the trend pattern remained relatively stable, with somewhat noticeable fluctuations being recorded throughout the analyzed period. The pace of growth was the most pronounced in 2023 with an increase of 15%. As a result, production reached the peak level of $2B, and then declined modestly in the following year.
Production By Country
The United States (599K tons) constituted the country with the largest volume of refined olive oil production, accounting for 87% of total volume. Moreover, refined olive oil production in the United States exceeded the figures recorded by the second-largest producer, Canada (86K tons), sevenfold.
From 2013 to 2024, the average annual rate of growth in terms of volume in the United States amounted to +1.8%.
ImportsNorthern America’s Imports of Refined Olive Oil
In 2024, refined olive oil imports in Northern America shrank slightly to 97K tons, which is down by -3.6% against the year before. Over the period under review, imports recorded a relatively flat trend pattern. The most prominent rate of growth was recorded in 2022 with an increase of 26%. As a result, imports reached the peak of 130K tons. From 2023 to 2024, the growth of imports remained at a lower figure.
In value terms, refined olive oil imports surged to $755M in 2024. Overall, imports, however, continue to indicate a prominent increase. The growth pace was the most rapid in 2022 when imports increased by 53%. Over the period under review, imports attained the peak figure in 2024 and are expected to retain growth in years to come.
Imports By Country
The United States dominates imports structure, resulting at 88K tons, which was approx. 91% of total imports in 2024. It was distantly followed by Canada (8.4K tons), generating an 8.7% share of total imports.
The United States experienced a relatively flat trend pattern with regard to volume of imports of refined olive oil. At the same time, Canada (+1.1%) displayed positive paces of growth. Moreover, Canada emerged as the fastest-growing importer imported in Northern America, with a CAGR of +1.1% from 2013-2024. The shares of the largest importers remained relatively stable throughout the analyzed period.
In value terms, the United States ($685M) constitutes the largest market for imported refined olive oil in Northern America, comprising 91% of total imports. The second position in the ranking was taken by Canada ($70M), with a 9.3% share of total imports.
In the United States, refined olive oil imports expanded at an average annual rate of +6.9% over the period from 2013-2024.
Import Prices By Country
The import price in Northern America stood at $7,808 per ton in 2024, with an increase of 35% against the previous year. Over the period under review, the import price recorded resilient growth. The pace of growth appeared the most rapid in 2023 when the import price increased by 45% against the previous year. Over the period under review, import prices attained the maximum in 2024 and is likely to see gradual growth in years to come.
Average prices varied noticeably amongst the major importing countries. In 2024, amid the top importers, the country with the highest price was Canada ($8,335 per ton), while the United States stood at $7,759 per ton.
From 2013 to 2024, the most notable rate of growth in terms of prices was attained by the United States (+7.4%).
ExportsNorthern America’s Exports of Refined Olive Oil
In 2024, shipments abroad of refined olive oil increased by 4.7% to 14K tons, rising for the fifth year in a row after two years of decline. Over the period under review, exports continue to indicate a resilient expansion. The most prominent rate of growth was recorded in 2022 when exports increased by 40% against the previous year. The volume of export peaked in 2024 and is expected to retain growth in the near future.
In value terms, refined olive oil exports amounted to $41M in 2024. Overall, exports posted a resilient increase. The growth pace was the most rapid in 2017 when exports increased by 36%. The level of export peaked in 2024 and is expected to retain growth in the near future.
Exports By Country
The shipments of the one major exporters of refined olive oil, namely the United States, represented more than two-thirds of total export.
The United States was also the fastest-growing in terms of the refined olive oil exports, with a CAGR of +6.2% from 2013 to 2024. The shares of the largest exporters remained relatively stable throughout the analyzed period.
In value terms, the United States ($41M) also remains the largest refined olive oil supplier in Northern America.
From 2013 to 2024, the average annual rate of growth in terms of value in the United States totaled +7.7%.
Export Prices By Country
The export price in Northern America stood at $2,866 per ton in 2024, reducing by -3.5% against the previous year. Over the period from 2013 to 2024, it increased at an average annual rate of +1.4%. The pace of growth appeared the most rapid in 2015 an increase of 11%. The level of export peaked at $3,038 per ton in 2021; however, from 2022 to 2024, the export prices remained at a lower figure.
As there is only one major export destination, the average price level is determined by prices for the United States.
From 2013 to 2024, the rate of growth in terms of prices for the United States amounted to +1.4% per year.
Source: IndexBox Market Intelligence Platform