

Jun 5, 2025
IndexBox has just published a new report: Europe – Olive Oil And Its Fractions – Market Analysis, Forecast, Size, Trends And Insights.
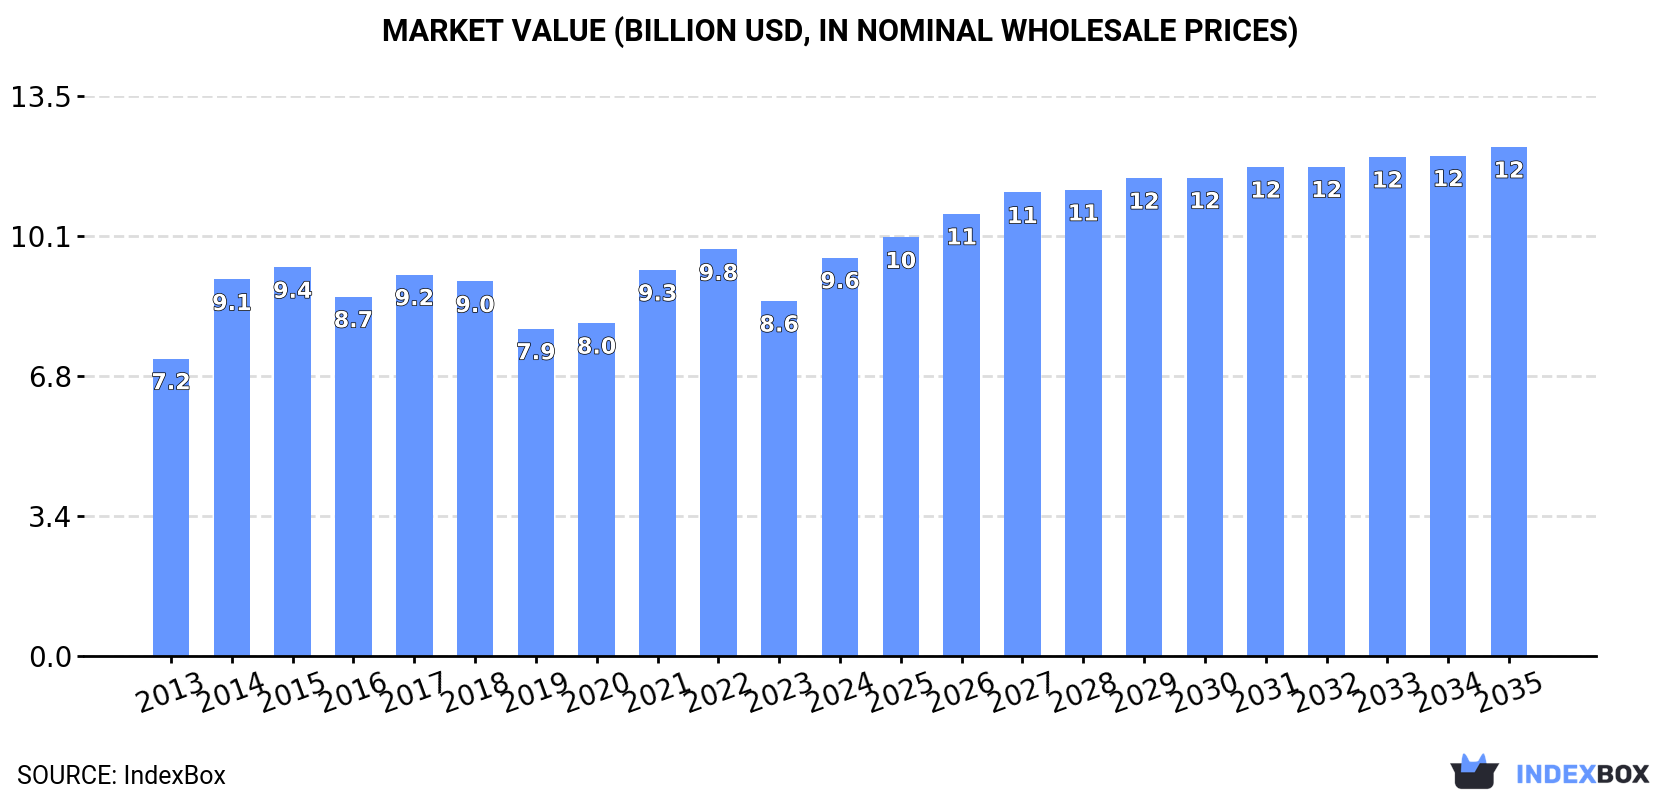
Driven by growing demand for olive oil in Europe, the market is predicted to continue its upward trajectory over the next decade. With a projected CAGR of +0.1% in volume and +2.3% in value terms, the market is expected to reach 2.4M tons and $12.3B by the end of 2035, respectively.
Market Forecast
Driven by increasing demand for olive oil and its fractions in Europe, the market is expected to continue an upward consumption trend over the next decade. Market performance is forecast to decelerate, expanding with an anticipated CAGR of +0.1% for the period from 2024 to 2035, which is projected to bring the market volume to 2.4M tons by the end of 2035.
In value terms, the market is forecast to increase with an anticipated CAGR of +2.3% for the period from 2024 to 2035, which is projected to bring the market value to $12.3B (in nominal wholesale prices) by the end of 2035.
 ConsumptionEurope’s Consumption of Olive Oil And Its Fractions
In 2024, after three years of decline, there was significant growth in consumption of olive oil and its fractions, when its volume increased by 12% to 2.4M tons. The total consumption volume increased at an average annual rate of +2.3% over the period from 2013 to 2024; the trend pattern remained relatively stable, with somewhat noticeable fluctuations being observed in certain years. As a result, consumption reached the peak volume of 2.5M tons. From 2015 to 2024, the growth of the consumption remained at a somewhat lower figure.
The revenue of the olive oil market in Europe rose rapidly to $9.6B in 2024, with an increase of 12% against the previous year. This figure reflects the total revenues of producers and importers (excluding logistics costs, retail marketing costs, and retailers’ margins, which will be included in the final consumer price). The market value increased at an average annual rate of +2.7% from 2013 to 2024; the trend pattern remained consistent, with somewhat noticeable fluctuations being recorded in certain years. The level of consumption peaked at $9.8B in 2022; however, from 2023 to 2024, consumption stood at a somewhat lower figure.
Consumption By Country
Spain (1.6M tons) remains the largest olive oil consuming country in Europe, comprising approx. 65% of total volume. Moreover, olive oil consumption in Spain exceeded the figures recorded by the second-largest consumer, Italy (430K tons), fourfold. France (102K tons) ranked third in terms of total consumption with a 4.2% share.
From 2013 to 2024, the average annual rate of growth in terms of volume in Spain stood at +5.5%. The remaining consuming countries recorded the following average annual rates of consumption growth: Italy (-3.0% per year) and France (-0.4% per year).
In value terms, Spain ($4.7B) led the market, alone. The second position in the ranking was held by Italy ($2B). It was followed by France.
From 2013 to 2024, the average annual growth rate of value in Spain amounted to +3.0%. The remaining consuming countries recorded the following average annual rates of market growth: Italy (-0.1% per year) and France (+4.7% per year).
In 2024, the highest levels of olive oil per capita consumption was registered in Spain (33 kg per person), followed by Italy (7.3 kg per person), Greece (5.9 kg per person) and France (1.5 kg per person), while the world average per capita consumption of olive oil was estimated at 3.3 kg per person.
From 2013 to 2024, the average annual growth rate of the olive oil per capita consumption in Spain stood at +5.4%. In the other countries, the average annual rates were as follows: Italy (-2.8% per year) and Greece (+10.8% per year).
ProductionEurope’s Production of Olive Oil And Its Fractions
In 2024, production of olive oil and its fractions was finally on the rise to reach 2.5M tons for the first time since 2021, thus ending a two-year declining trend. The total output volume increased at an average annual rate of +1.9% from 2013 to 2024; the trend pattern remained relatively stable, with somewhat noticeable fluctuations being observed in certain years. The growth pace was the most rapid in 2014 when the production volume increased by 39% against the previous year. As a result, production reached the peak volume of 2.8M tons. From 2015 to 2024, production growth remained at a somewhat lower figure.
In value terms, olive oil production rose notably to $10.4B in 2024 estimated in export price. The total output value increased at an average annual rate of +2.3% over the period from 2013 to 2024; the trend pattern remained relatively stable, with somewhat noticeable fluctuations being recorded throughout the analyzed period. The most prominent rate of growth was recorded in 2014 with an increase of 29% against the previous year. The level of production peaked at $11.4B in 2022; however, from 2023 to 2024, production stood at a somewhat lower figure.
Production By Country
The country with the largest volume of olive oil production was Spain (1.8M tons), comprising approx. 74% of total volume. Moreover, olive oil production in Spain exceeded the figures recorded by the second-largest producer, Italy (303K tons), sixfold. Greece (180K tons) ranked third in terms of total production with a 7.2% share.
From 2013 to 2024, the average annual growth rate of volume in Spain totaled +3.2%. In the other countries, the average annual rates were as follows: Italy (-3.6% per year) and Greece (+0.5% per year).
ImportsEurope’s Imports of Olive Oil And Its Fractions
In 2024, overseas purchases of olive oil and its fractions increased by 2.9% to 954K tons for the first time since 2020, thus ending a three-year declining trend. Over the period under review, imports saw a relatively flat trend pattern. The growth pace was the most rapid in 2020 when imports increased by 21% against the previous year. As a result, imports reached the peak of 1.3M tons. From 2021 to 2024, the growth of imports remained at a lower figure.
In value terms, olive oil imports surged to $8B in 2024. In general, imports continue to indicate a strong expansion. As a result, imports attained the peak and are likely to continue growth in the immediate term.
Imports By Country
Italy represented the major importing country with an import of around 362K tons, which amounted to 38% of total imports. It was distantly followed by Spain (191K tons), France (106K tons), Portugal (75K tons) and Germany (56K tons), together committing a 45% share of total imports. The UK (39K tons) and the Netherlands (15K tons) held a little share of total imports.
From 2013 to 2024, the most notable rate of growth in terms of purchases, amongst the key importing countries, was attained by Spain (with a CAGR of +5.0%), while imports for the other leaders experienced more modest paces of growth.
In value terms, Italy ($3.1B) constitutes the largest market for imported olive oil and its fractions in Europe, comprising 39% of total imports. The second position in the ranking was held by Spain ($1.4B), with a 17% share of total imports. It was followed by France, with an 11% share.
In Italy, olive oil imports expanded at an average annual rate of +7.1% over the period from 2013-2024. In the other countries, the average annual rates were as follows: Spain (+13.2% per year) and France (+6.8% per year).
Import Prices By Country
The import price in Europe stood at $8,432 per ton in 2024, surging by 31% against the previous year. Over the period under review, the import price showed a prominent increase. The growth pace was the most rapid in 2023 an increase of 57% against the previous year. The level of import peaked in 2024 and is expected to retain growth in the immediate term.
Average prices varied somewhat amongst the major importing countries. In 2024, major importing countries recorded the following prices: in Germany ($10,874 per ton) and the UK ($10,257 per ton), while Spain ($7,322 per ton) and Portugal ($7,530 per ton) were amongst the lowest.
From 2013 to 2024, the most notable rate of growth in terms of prices was attained by the UK (+9.1%), while the other leaders experienced more modest paces of growth.
ExportsEurope’s Exports of Olive Oil And Its Fractions
In 2024, shipments abroad of olive oil and its fractions decreased by -2.9% to 1M tons, falling for the fourth year in a row after three years of growth. Over the period under review, exports showed a relatively flat trend pattern. The most prominent rate of growth was recorded in 2014 when exports increased by 28% against the previous year. The volume of export peaked at 1.5M tons in 2020; however, from 2021 to 2024, the exports stood at a somewhat lower figure.
In value terms, olive oil exports soared to $9.7B in 2024. Total exports indicated a strong expansion from 2013 to 2024: its value increased at an average annual rate of +7.1% over the last eleven years. The trend pattern, however, indicated some noticeable fluctuations being recorded throughout the analyzed period. Based on 2024 figures, exports increased by +93.9% against 2019 indices. As a result, the exports reached the peak and are likely to continue growth in the immediate term.
Exports By Country
Spain represented the largest exporter of olive oil and its fractions in Europe, with the volume of exports resulting at 469K tons, which was near 46% of total exports in 2024. Italy (236K tons) ranks second in terms of the total exports with a 23% share, followed by Portugal (17%) and Greece (12%).
From 2013 to 2024, the biggest increases were recorded for Portugal (with a CAGR of +7.3%), while shipments for the other leaders experienced a decline in the exports figures.
In value terms, Spain ($4.2B), Italy ($2.6B) and Portugal ($1.5B) constituted the countries with the highest levels of exports in 2024, together comprising 86% of total exports.
In terms of the main exporting countries, Portugal, with a CAGR of +14.2%, saw the highest growth rate of the value of exports, over the period under review, while shipments for the other leaders experienced more modest paces of growth.
Export Prices By Country
The export price in Europe stood at $9,407 per ton in 2024, picking up by 35% against the previous year. Over the period under review, the export price saw strong growth. The pace of growth was the most pronounced in 2023 when the export price increased by 55% against the previous year. The level of export peaked in 2024 and is expected to retain growth in the immediate term.
Average prices varied somewhat amongst the major exporting countries. In 2024, major exporting countries recorded the following prices: in Italy ($10,920 per ton) and Greece ($9,810 per ton), while Portugal ($8,362 per ton) and Spain ($8,959 per ton) were amongst the lowest.
From 2013 to 2024, the most notable rate of growth in terms of prices was attained by Greece (+8.6%), while the other leaders experienced more modest paces of growth.
Source: IndexBox Market Intelligence Platform