

Aug 26, 2025
IndexBox has just published a new report: Latin America and the Caribbean – Refined Olive Oil – Market Analysis, Forecast, Size, Trends And Insights.
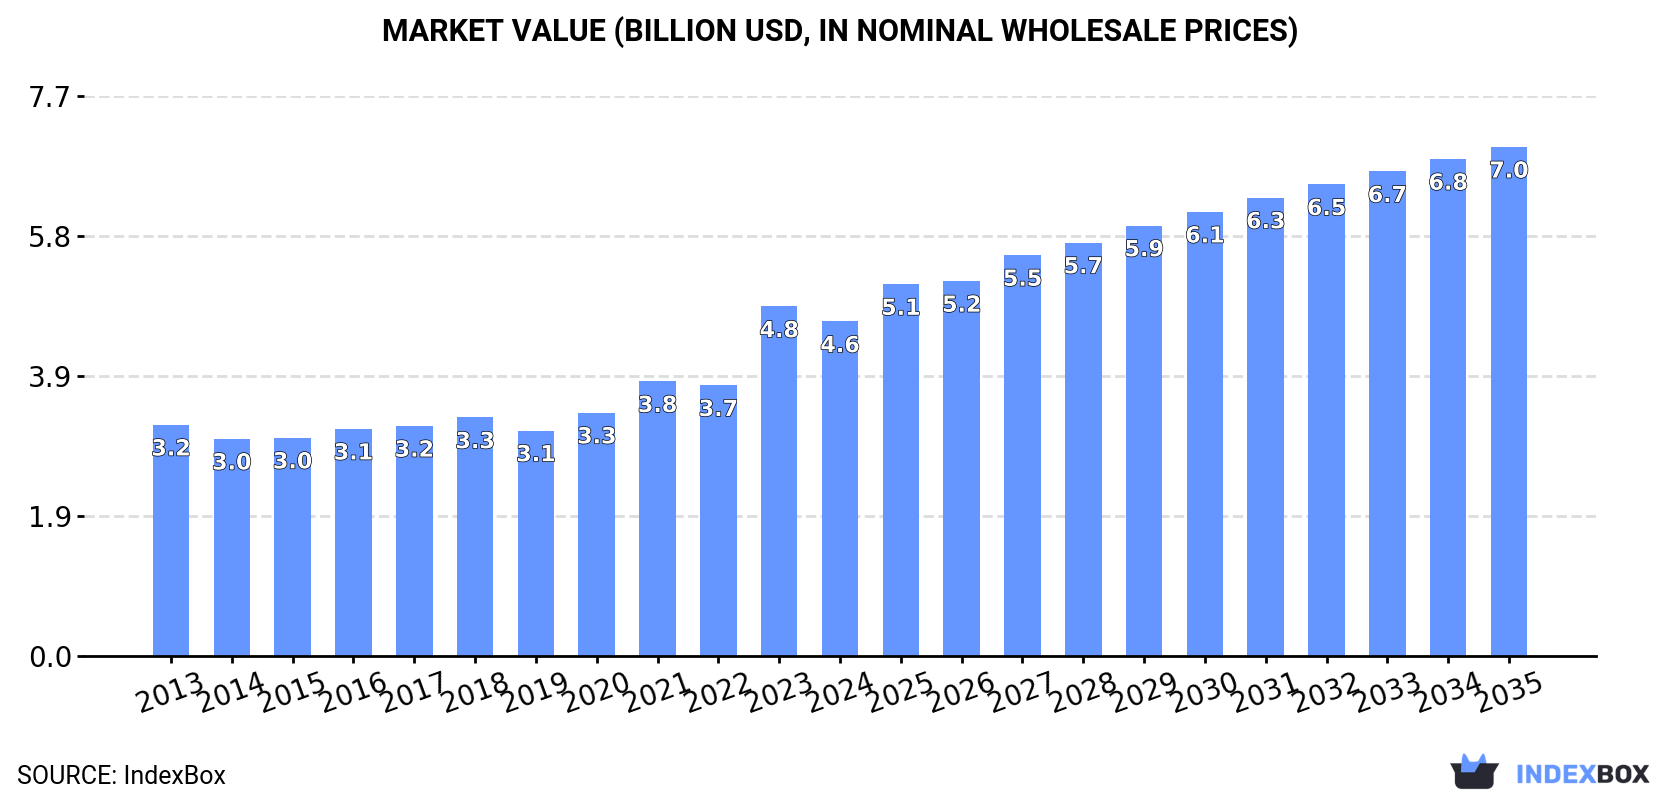
Driven by rising demand, the market for refined olive oil in Latin America and the Caribbean is expected to see continued growth, with a forecasted increase in volume to 934K tons and value to $7B by 2035. Anticipated CAGR rates of +1.4% and +3.9% respectively indicate a promising future for the industry.
Market Forecast
Driven by increasing demand for refined olive oil in Latin America and the Caribbean, the market is expected to continue an upward consumption trend over the next decade. Market performance is forecast to retain its current trend pattern, expanding with an anticipated CAGR of +1.4% for the period from 2024 to 2035, which is projected to bring the market volume to 934K tons by the end of 2035.
In value terms, the market is forecast to increase with an anticipated CAGR of +3.9% for the period from 2024 to 2035, which is projected to bring the market value to $7B (in nominal wholesale prices) by the end of 2035.
 ConsumptionLatin America and the Caribbean’s Consumption of Refined Olive Oil
In 2024, consumption of refined olive oil decreased by -0.6% to 801K tons, falling for the second consecutive year after four years of growth. In general, consumption, however, recorded a relatively flat trend pattern. The pace of growth appeared the most rapid in 2020 when the consumption volume increased by 7.6%. Over the period under review, consumption hit record highs at 817K tons in 2022; however, from 2023 to 2024, consumption remained at a lower figure.
The value of the refined olive oil market in Latin America and the Caribbean shrank slightly to $4.6B in 2024, which is down by -4.3% against the previous year. This figure reflects the total revenues of producers and importers (excluding logistics costs, retail marketing costs, and retailers’ margins, which will be included in the final consumer price). The total consumption indicated tangible growth from 2013 to 2024: its value increased at an average annual rate of +3.4% over the last eleven years. The trend pattern, however, indicated some noticeable fluctuations being recorded throughout the analyzed period. Based on 2024 figures, consumption increased by +48.4% against 2019 indices. As a result, consumption attained the peak level of $4.8B, and then reduced slightly in the following year.
Consumption By Country
The countries with the highest volumes of consumption in 2024 were Brazil (221K tons), Mexico (161K tons) and Argentina (70K tons), together accounting for 56% of total consumption. Colombia, Venezuela, Chile, Peru, Ecuador, Cuba and the Dominican Republic lagged somewhat behind, together comprising a further 28%.
From 2013 to 2024, the biggest increases were recorded for the Dominican Republic (with a CAGR of +1.9%), while consumption for the other leaders experienced more modest paces of growth.
In value terms, the largest refined olive oil markets in Latin America and the Caribbean were Brazil ($1.6B), Mexico ($826M) and Argentina ($427M), together comprising 63% of the total market.
Argentina, with a CAGR of +5.5%, recorded the highest rates of growth with regard to market size among the main consuming countries over the period under review, while market for the other leaders experienced more modest paces of growth.
The countries with the highest levels of refined olive oil per capita consumption in 2024 were Chile (1.9 kg per person), the Dominican Republic (1.7 kg per person) and Cuba (1.7 kg per person).
From 2013 to 2024, the biggest increases were recorded for the Dominican Republic (with a CAGR of +0.8%), while consumption for the other leaders experienced more modest paces of growth.
ProductionLatin America and the Caribbean’s Production of Refined Olive Oil
In 2024, production of refined olive oil decreased by -0.8% to 776K tons, falling for the second consecutive year after four years of growth. Over the period under review, production, however, continues to indicate a relatively flat trend pattern. The most prominent rate of growth was recorded in 2020 when the production volume increased by 6.7% against the previous year. Over the period under review, production reached the peak volume at 786K tons in 2022; however, from 2023 to 2024, production remained at a lower figure.
In value terms, refined olive oil production declined to $4.9B in 2024 estimated in export price. The total production indicated a moderate increase from 2013 to 2024: its value increased at an average annual rate of +4.5% over the last eleven years. The trend pattern, however, indicated some noticeable fluctuations being recorded throughout the analyzed period. Based on 2024 figures, production increased by +64.9% against 2019 indices. The pace of growth appeared the most rapid in 2023 when the production volume increased by 44%. As a result, production attained the peak level of $5.2B, and then reduced in the following year.
Production By Country
The countries with the highest volumes of production in 2024 were Brazil (209K tons), Mexico (157K tons) and Argentina (72K tons), together comprising 56% of total production. Colombia, Venezuela, Chile, Peru, Ecuador, Cuba and the Dominican Republic lagged somewhat behind, together accounting for a further 28%.
From 2013 to 2024, the most notable rate of growth in terms of production, amongst the leading producing countries, was attained by the Dominican Republic (with a CAGR of +2.2%), while production for the other leaders experienced more modest paces of growth.
ImportsLatin America and the Caribbean’s Imports of Refined Olive Oil
In 2024, overseas purchases of refined olive oil were finally on the rise to reach 26K tons after three years of decline. Over the period under review, imports, however, saw a mild slump. The growth pace was the most rapid in 2020 with an increase of 42%. As a result, imports attained the peak of 34K tons. From 2021 to 2024, the growth of imports failed to regain momentum.
In value terms, refined olive oil imports soared to $216M in 2024. Overall, imports enjoyed a tangible increase. As a result, imports reached the peak and are likely to continue growth in the immediate term.
Imports By Country
In 2024, Brazil (12K tons) was the key importer of refined olive oil, making up 45% of total imports. Mexico (4K tons) took a 15% share (based on physical terms) of total imports, which put it in second place, followed by Guatemala (8.1%). Belize (1,111 tons), Costa Rica (1,076 tons), El Salvador (998 tons), Peru (683 tons), Ecuador (628 tons), Chile (607 tons) and the Dominican Republic (578 tons) took a relatively small share of total imports.
Imports into Brazil decreased at an average annual rate of -3.1% from 2013 to 2024. At the same time, Belize (+27.4%), Peru (+15.0%), Chile (+15.0%), Guatemala (+14.9%), El Salvador (+6.4%), Costa Rica (+2.5%) and Ecuador (+2.2%) displayed positive paces of growth. Moreover, Belize emerged as the fastest-growing importer imported in Latin America and the Caribbean, with a CAGR of +27.4% from 2013-2024. By contrast, Mexico (-1.9%) and the Dominican Republic (-4.3%) illustrated a downward trend over the same period. While the share of Guatemala (+6.5 p.p.), Belize (+4 p.p.), Peru (+2.1 p.p.), El Salvador (+2.1 p.p.) and Chile (+1.9 p.p.) increased significantly in terms of the total imports from 2013-2024, the share of Mexico (-1.7 p.p.) and Brazil (-12.4 p.p.) displayed negative dynamics. The shares of the other countries remained relatively stable throughout the analyzed period.
In value terms, Brazil ($111M) constitutes the largest market for imported refined olive oil in Latin America and the Caribbean, comprising 52% of total imports. The second position in the ranking was held by Mexico ($37M), with a 17% share of total imports. It was followed by Guatemala, with an 8% share.
From 2013 to 2024, the average annual rate of growth in terms of value in Brazil stood at +2.7%. The remaining importing countries recorded the following average annual rates of imports growth: Mexico (+9.0% per year) and Guatemala (+20.1% per year).
Import Prices By Country
In 2024, the import price in Latin America and the Caribbean amounted to $8,217 per ton, jumping by 26% against the previous year. Over the period under review, the import price enjoyed a strong increase. The pace of growth was the most pronounced in 2023 when the import price increased by 46% against the previous year. The level of import peaked in 2024 and is expected to retain growth in the near future.
Prices varied noticeably by country of destination: amid the top importers, the country with the highest price was the Dominican Republic ($11,592 per ton), while Belize ($1,300 per ton) was amongst the lowest.
From 2013 to 2024, the most notable rate of growth in terms of prices was attained by the Dominican Republic (+12.7%), while the other leaders experienced more modest paces of growth.
ExportsLatin America and the Caribbean’s Exports of Refined Olive Oil
In 2024, approx. 1.7K tons of refined olive oil were exported in Latin America and the Caribbean; picking up by 56% against the year before. In general, exports, however, showed a abrupt setback. The growth pace was the most rapid in 2020 with an increase of 95%. As a result, the exports attained the peak of 4.2K tons. From 2021 to 2024, the growth of the exports failed to regain momentum.
In value terms, refined olive oil exports surged to $13M in 2024. Overall, exports, however, continue to indicate a relatively flat trend pattern. The most prominent rate of growth was recorded in 2020 with an increase of 88% against the previous year. The level of export peaked at $14M in 2017; however, from 2018 to 2024, the exports stood at a somewhat lower figure.
Exports By Country
Argentina prevails in exports structure, finishing at 1.5K tons, which was approx. 89% of total exports in 2024. The following exporters – Chile (63 tons), Mexico (43 tons) and Peru (29 tons) – together made up 8% of total exports.
Exports from Argentina decreased at an average annual rate of -6.2% from 2013 to 2024. At the same time, Mexico (+26.8%) displayed positive paces of growth. Moreover, Mexico emerged as the fastest-growing exporter exported in Latin America and the Caribbean, with a CAGR of +26.8% from 2013-2024. By contrast, Peru (-7.8%) and Chile (-16.9%) illustrated a downward trend over the same period. While the share of Argentina (+6.3 p.p.) and Mexico (+2.5 p.p.) increased significantly in terms of the total exports from 2013-2024, the share of Chile (-9.4 p.p.) displayed negative dynamics. The shares of the other countries remained relatively stable throughout the analyzed period.
In value terms, Argentina ($11M) remains the largest refined olive oil supplier in Latin America and the Caribbean, comprising 90% of total exports. The second position in the ranking was held by Chile ($396K), with a 3.2% share of total exports. It was followed by Mexico, with a 3.1% share.
In Argentina, refined olive oil exports remained relatively stable over the period from 2013-2024. In the other countries, the average annual rates were as follows: Chile (-12.4% per year) and Mexico (+37.9% per year).
Export Prices By Country
In 2024, the export price in Latin America and the Caribbean amounted to $7,382 per ton, increasing by 11% against the previous year. Overall, the export price showed strong growth. The growth pace was the most rapid in 2023 when the export price increased by 62%. Over the period under review, the export prices hit record highs in 2024 and is expected to retain growth in the immediate term.
There were significant differences in the average prices amongst the major exporting countries. In 2024, amid the top suppliers, the country with the highest price was Mexico ($9,047 per ton), while Peru ($2,997 per ton) was amongst the lowest.
From 2013 to 2024, the most notable rate of growth in terms of prices was attained by Mexico (+8.7%), while the other leaders experienced more modest paces of growth.
Source: IndexBox Market Intelligence Platform
Dining and Cooking