

Aug 28, 2025
IndexBox has just published a new report: Northern America – Olive Oil And Its Fractions – Market Analysis, Forecast, Size, Trends And Insights.
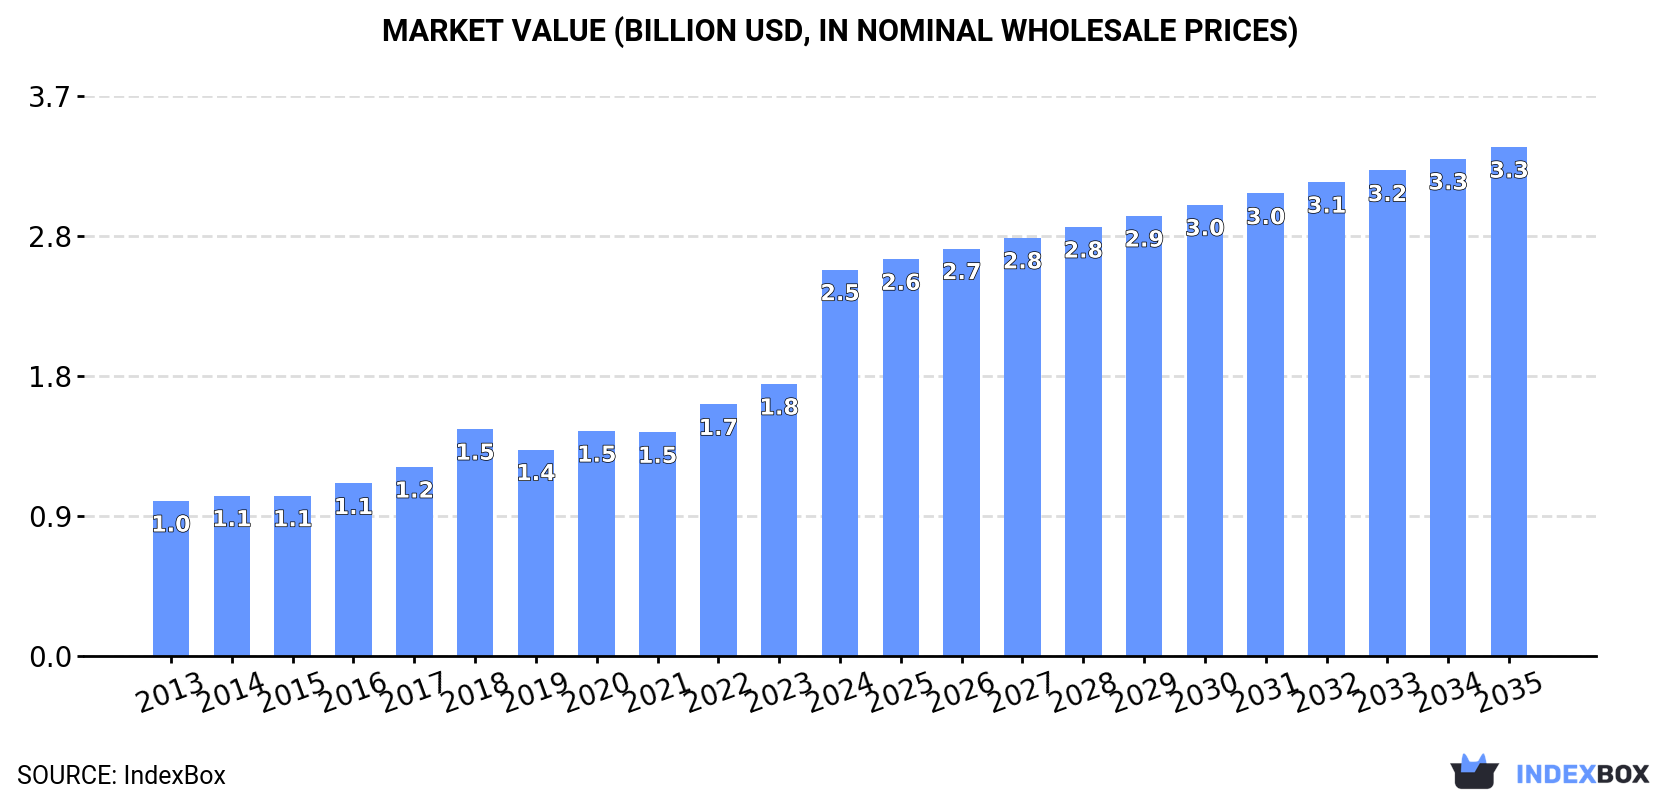
The article discusses the rising demand for olive oil in Northern America and projects a continuous upward consumption trend over the next decade. The market performance is expected to slow down with a CAGR of +1.0% in volume and +2.5% in value from 2024 to 2035. By the end of 2035, the market volume is estimated to reach 363K tons and the market value to grow to $3.3B.
Market Forecast
Driven by increasing demand for olive oil and its fractions in Northern America, the market is expected to continue an upward consumption trend over the next decade. Market performance is forecast to decelerate, expanding with an anticipated CAGR of +1.0% for the period from 2024 to 2035, which is projected to bring the market volume to 363K tons by the end of 2035.
In value terms, the market is forecast to increase with an anticipated CAGR of +2.5% for the period from 2024 to 2035, which is projected to bring the market value to $3.3B (in nominal wholesale prices) by the end of 2035.
 ConsumptionNorthern America’s Consumption of Olive Oil And Its Fractions
In 2024, the amount of olive oil and its fractions consumed in Northern America amounted to 324K tons, surging by 7.8% compared with the previous year’s figure. The total consumption indicated a temperate increase from 2013 to 2024: its volume increased at an average annual rate of +3.5% over the last eleven years. The trend pattern, however, indicated some noticeable fluctuations being recorded throughout the analyzed period. Based on 2024 figures, consumption decreased by -10.2% against 2020 indices. Over the period under review, consumption attained the peak volume at 361K tons in 2020; however, from 2021 to 2024, consumption stood at a somewhat lower figure.
The value of the olive oil market in Northern America soared to $2.5B in 2024, increasing by 42% against the previous year. This figure reflects the total revenues of producers and importers (excluding logistics costs, retail marketing costs, and retailers’ margins, which will be included in the final consumer price). In general, consumption saw a buoyant expansion. As a result, consumption reached the peak level and is likely to continue growth in the immediate term.
Consumption By Country
The United States (283K tons) constituted the country with the largest volume of olive oil consumption, comprising approx. 87% of total volume. Moreover, olive oil consumption in the United States exceeded the figures recorded by the second-largest consumer, Canada (41K tons), sevenfold.
From 2013 to 2024, the average annual growth rate of volume in the United States amounted to +3.5%.
In value terms, the United States ($2.2B) led the market, alone. The second position in the ranking was held by Canada ($314M).
From 2013 to 2024, the average annual rate of growth in terms of value in the United States amounted to +9.3%.
The countries with the highest levels of olive oil per capita consumption in 2024 were Canada (1,043 kg per 1000 persons) and the United States (836 kg per 1000 persons).
From 2013 to 2024, the most notable rate of growth in terms of consumption, amongst the key consuming countries, was attained by the United States (with a CAGR of +2.9%).
ProductionNorthern America’s Production of Olive Oil And Its Fractions
In 2024, approx. 16K tons of olive oil and its fractions were produced in Northern America; leveling off at the previous year. The total production indicated a tangible expansion from 2013 to 2024: its volume increased at an average annual rate of +4.4% over the last eleven years. The trend pattern, however, indicated some noticeable fluctuations being recorded throughout the analyzed period. Based on 2024 figures, production increased by +100.0% against 2014 indices. The most prominent rate of growth was recorded in 2015 with an increase of 75% against the previous year. The volume of production peaked in 2024 and is likely to see gradual growth in years to come.
In value terms, olive oil production declined to $52M in 2024 estimated in export price. The total production indicated a noticeable increase from 2013 to 2024: its value increased at an average annual rate of +2.1% over the last eleven-year period. The trend pattern, however, indicated some noticeable fluctuations being recorded throughout the analyzed period. Based on 2024 figures, production decreased by -18.7% against 2021 indices. The growth pace was the most rapid in 2015 when the production volume increased by 66%. Over the period under review, production reached the maximum level at $64M in 2017; however, from 2018 to 2024, production failed to regain momentum.
Production By Country
The country with the largest volume of olive oil production was the United States (16K tons), comprising approx. 100% of total volume.
In the United States, olive oil production expanded at an average annual rate of +4.4% over the period from 2013-2024.
ImportsNorthern America’s Imports of Olive Oil And Its Fractions
In 2024, olive oil imports in Northern America expanded markedly to 319K tons, surging by 9.3% against the previous year’s figure. Total imports indicated a moderate expansion from 2013 to 2024: its volume increased at an average annual rate of +3.5% over the last eleven years. The trend pattern, however, indicated some noticeable fluctuations being recorded throughout the analyzed period. Based on 2024 figures, imports decreased by -8.9% against 2020 indices. The most prominent rate of growth was recorded in 2018 with an increase of 22%. Over the period under review, imports reached the maximum at 350K tons in 2020; however, from 2021 to 2024, imports stood at a somewhat lower figure.
In value terms, olive oil imports skyrocketed to $2.9B in 2024. In general, imports showed resilient growth. As a result, imports attained the peak and are likely to continue growth in the immediate term.
Imports By Country
The United States represented the major importer of olive oil and its fractions in Northern America, with the volume of imports resulting at 278K tons, which was approx. 87% of total imports in 2024. It was distantly followed by Canada (41K tons), generating a 13% share of total imports.
The United States was also the fastest-growing in terms of the olive oil and its fractions imports, with a CAGR of +3.6% from 2013 to 2024. At the same time, Canada (+3.3%) displayed positive paces of growth. The shares of the largest importers remained relatively stable throughout the analyzed period.
In value terms, the United States ($2.5B) constitutes the largest market for imported olive oil and its fractions in Northern America, comprising 88% of total imports. The second position in the ranking was held by Canada ($360M), with a 12% share of total imports.
In the United States, olive oil imports expanded at an average annual rate of +11.1% over the period from 2013-2024.
Import Prices By Country
In 2024, the import price in Northern America amounted to $9,088 per ton, jumping by 44% against the previous year. Overall, the import price saw strong growth. As a result, import price attained the peak level and is likely to continue growth in the immediate term.
Average prices varied noticeably amongst the major importing countries. In 2024, amid the top importers, the country with the highest price was the United States ($9,138 per ton), while Canada totaled $8,759 per ton.
From 2013 to 2024, the most notable rate of growth in terms of prices was attained by the United States (+7.2%).
ExportsNorthern America’s Exports of Olive Oil And Its Fractions
In 2024, overseas shipments of olive oil and its fractions increased by 58% to 10K tons, rising for the fifth year in a row after three years of decline. Over the period under review, exports posted a strong expansion. As a result, the exports reached the peak and are likely to continue growth in the immediate term.
In value terms, olive oil exports skyrocketed to $34M in 2024. Total exports indicated a perceptible increase from 2013 to 2024: its value increased at an average annual rate of +4.0% over the last eleven-year period. The trend pattern, however, indicated some noticeable fluctuations being recorded throughout the analyzed period. Based on 2024 figures, exports increased by +53.5% against 2021 indices. As a result, the exports reached the peak and are likely to continue growth in the immediate term.
Exports By Country
The United States (10K tons) represented roughly 99% of total exports in 2024.
The United States was also the fastest-growing in terms of the olive oil and its fractions exports, with a CAGR of +6.7% from 2013 to 2024. While the share of the United States (+3.8 p.p.) increased significantly, the shares of the other countries remained relatively stable throughout the analyzed period.
In value terms, the United States ($32M) also remains the largest olive oil supplier in Northern America.
From 2013 to 2024, the average annual growth rate of value in the United States totaled +4.1%.
Export Prices By Country
The export price in Northern America stood at $3,221 per ton in 2024, falling by -2.2% against the previous year. In general, the export price continues to indicate a pronounced decline. The most prominent rate of growth was recorded in 2021 when the export price increased by 9.7% against the previous year. The level of export peaked at $4,466 per ton in 2014; however, from 2015 to 2024, the export prices stood at a somewhat lower figure.
As there is only one major export destination, the average price level is determined by prices for the United States.
From 2013 to 2024, the rate of growth in terms of prices for the United States amounted to -2.5% per year.
Source: IndexBox Market Intelligence Platform
Dining and Cooking