

UV–Vis spectroscopy
UV–Vis spectroscopy serves as a valuable tool for characterising materials across diverse scales, ranging from nanoparticles to bulk solids. This technique can provide insights into a material’s composition, structure, and interactions with light55.
Figure 2 illustrates the ultraviolet–visible spectra of the manufactured composite films. A diverse array of bands was discerned, spanning a range of 250 to 375 nm for the control sample (SIV1) and a broader range of 250 to 500 nm for the samples containing beeswax (SIV2, SIV3 and SIV4). The spectra of beeswax exhibit absorption peaks within the ultraviolet (UV) range of 200 to 400 nm, with a maximum absorption observed at 290 nm56. In olive oil, the characteristic absorbance between 300 and 500 nm has been linked to different classes of phenolic compounds57. The primary visible bands are situated between 200 and 400 nm, which is within the near ultraviolet region. It can be concluded that these bands originate from the excitation of n → π* (C = C) anti-binding electrons and from transitions of binding orbitals to π → π* (C = O) non-binding orbitals58. The shape and interactions of a molecule can influence absorption wavelengths, particularly in π → π* transitions. Intermolecular interactions may lead to alterations in the absorption spectrum. In samples containing nanocapsules, an increase in absorbance and a characteristic peak at 265–270 nm were observed. This same effect was noted in our previous studies7,10. UV–Vis absorption features in a material can have significant implications for its functionality, particularly in fields such as optics, electronics, and materials science. The presence and characteristics of these absorptions may determine how a material interacts with light, influencing its capacity to transmit, reflect, or absorb electromagnetic radiation. Such interactions may also impact the material’s electronic and chemical properties. Additionally, UV–Vis absorptions can offer information about the material’s chemical structure and composition. Specific wavelengths at which absorption occurs may correspond to characteristic functional groups or molecules within the material. The samples containing beeswax nanostructures exhibited a higher level of absorbance than the control sample. Furthermore, the absorption capacity is directly proportional to the concentration of nanoparticles in the matrix. This suggests that the incorporation of nanostructures enhanced the ultraviolet barrier properties of the resulting films, which is in accordance with previous studies7,34,59,60.
Fig. 2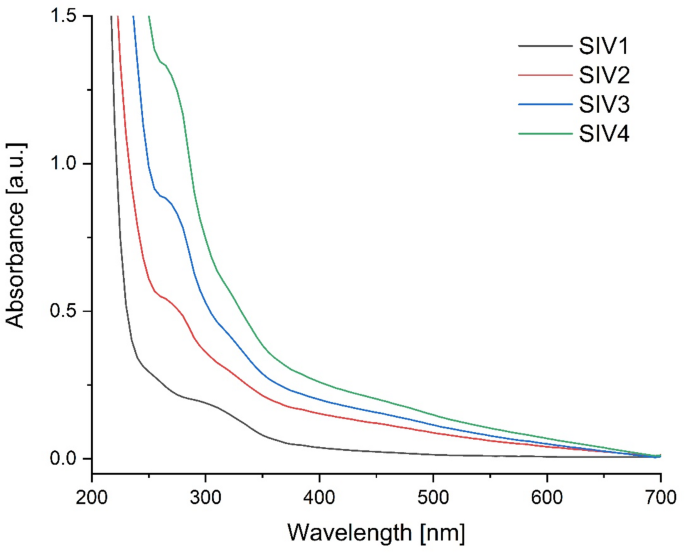
UV–VIS spectra of obtained composite films.
Fourier transform infrared attenuated total reflection (FTIR-ATR) spectroscopy
Figure 3 depicts a comparative analysis of FTIR-ATR spectra within the spectral range of 700–4000 cm−1 of olive oil and beeswax with those of SIV1, SIV2, SIV3 and SIV4 composite films. The spectrum of beeswax exhibited discernible infrared absorption peaks at 2954, 2915, 2849, 1744, 1460, 1373, and 1157 cm−1. The peaks at 2915 and 2849 cm−1 indicate the presence of fatty acid chains, which can be attributed to stretching vibrations of C–H groups. The peak at 1744 cm−1 is due to stretching vibrations of ester carbonyls. The peaks at 2954 and 1460 cm−1 are attributed to the vibrations of hydrocarbons, while the peaks at 1373 and 1220–1150 cm−1 are indicative of amide groups12. The asymmetric and symmetric stretching vibrations of the –CH2 and CH3 groups, occurring at wave numbers 2915 cm−1 and 2849 cm−1, are also present in the spectrum of olive oil8,61.
Fig. 3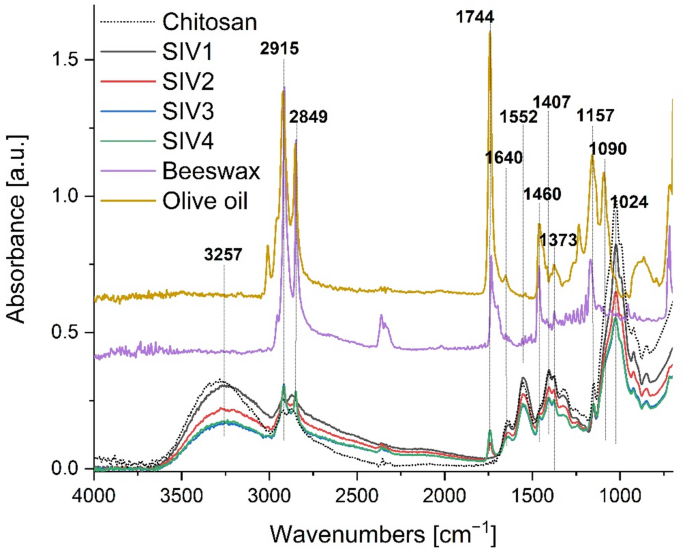
A comparison of FTIR-ATR spectra of chitosan, olive oil and beeswax with those of SIV1, SIV2, SIV3 and SIV4 composites.
The spectrum of the control sample (SIV1) comprises characteristic bands for chitosan composite films, as previously documented in the literature9,10,62,63. The broad band observed at 3257 cm−1 is associated with the stretching vibrations of the –OH and –NH2 groups. Furthermore, the presence of carbonyl groups (C = O)9,64 is indicated by the appearance of bands at 1744 cm−1. The peak at 1028 cm−1 is attributed to the stretching of C–O and vibrations of O–H in chitosan65. The notable disparity between the spectrum of the control sample and those containing beeswax capsules can be attributed to the presence of olive oil and beeswax. In the samples containing beeswax capsules, intense bands are observed at wavelengths of 2915 and 2849 cm−1, resulting from asymmetric and symmetric vibrations of saturated hydrocarbons, respectively.
The absorption bands appear to be similar across all films, indicating that the encapsulation process did not affect the chitosan structure. In the spectra obtained for films containing beeswax and oil, bands corresponding to the encapsulated components are observed. The decrease in absorbance intensity of the band at 3257 cm−1 in samples containing capsules suggests the involvement of –OH and –NH2 groups in the stabilisation of the nanoemulsion. The reduction in absorbance intensity and slight shifts in the bands for samples containing capsules with wax and oil may be attributed to variations in water content9,66. The addition of oil and wax increased the hydrophobicity of the sample.
Colour measurements and opacity
Table 2 presents a series of parameters that characterise the colour of the surface of the resulting films. Colour is defined by three parameters: tone (hue), saturation (chroma) and lightness (L*). The L* parameter is used to describe the brightness (luminance) of a given colour. The range is from 0 to 100, with 100 indicating the brightest colour10. Lightness is related to the amount of light reflected or transmitted through an object. Colour is therefore perceived as light or dark. The analysed biocomposites exhibited high luminance, from 95 to 97 (Tab. 2), which was was comparable with chitosan film developed by Velickova et al.67. Nevertheless, the incorporation of beeswax and olive oil to chitosan matrix resulted in a slight reduction (from 1.3 to 3.2%) in this parameter. Chitosan gel, like its films, has a high transparency. Beeswax, on the other hand, can vary in colour. Fresh wax is colourless or white, while darkening and browning is caused by admixtures of bee putty or pollen, among other things68. The a* coordinate represents the proportion of green (negative values) or red (positive values). Conversely, the b* coordinate is associated with positive values for yellowish colours and negative values for bluish colours34. All samples exhibited a predominant green and yellow share of colour. A notable distinction was evident in the b* parameter, where an increase in the concentration of wax in the film resulted in a noticeable enhancement of the yellow colour. It is worth noting that the colour of the samples was more than twice as saturated as that of the control sample (SIV1). The higher the concentration of beeswax emulsion in the composite, the higher the saturation (C*) of colour. Tone (h*) is the chromatic characteristic of a colour and determines the type of colour, i.e. whether it is red, green, yellow, etc. This parameters matched with very light yellow colour.
Table 2 Colour of the biocomposites and their opacity.
Based on measurements of chromatic values and brightness, the total colour difference (∆Eab*) of the biocomposites relative to the standard, which was sample SIV1 (chitosan biocomposite), was also calculated. The obtained data indicate that the differences in perceived colour between the samples (SIV2, SIV3 and SIV4) and the control is clear from values of 6.53 to 12.72. A value in the range 3.5 < ∆E < 5 is defined as a clearly noticeable colour difference, while above 5 the observer gets the impression of two different colours69,70,71.
The opacity of the film was found to increase in proportion to the quantity of wax present. The observed alterations are attributable to the pigmentation of the wax, which is more pronounced than that of the chitosan gel.
Scanning electron microscopy (SEM)
Figures 4A and B illustrate the surfaces of the control sample (SIV1) and the sample containing beeswax capsules (SIV2), respectively, as observed under an electron microscope at a magnification of 2500 times. The surface of the control sample is observed to be smooth, while in the beeswax sample, evenly distributed spherical nanostructures are seen to range in size from a 1000 to 3000 nm. It is noteworthy that the capsules exhibit deformation and/or opening under measurement conditions, namely high vacuum and electron bombardment. The following images illustrate the samples at magnifications of 10,000 and 25,500 times, respectively, for SIV2 (Fig. 4C and D), SIV3 (Fig. 4E and F) and SIV4 (Fig. 4G and H). The presence of spherical structures, comprising a core and a shell, is observed in all samples. The cross-section of the sample also expresses visible spherical structures distributed evenly in the material (Fig. 4I). A similar result was observed for curcumin nanocapsules in a chitosan-alginate matrix7. Sample SIV4 (Fig. 4G and H) demonstrates reduced stability under measurement conditions. Complete failure of the capsule and the flow of contents were observed. This is likely due to the high concentration of wax and oil. Similar results were obtained in a paper on propolis encapsulation in hyaluronic acid72. The comprehensive analysis confirms the efficacy of the nanoemulsion encapsulation method employing chitosan as both a stabilising shell and a functional matrix. The results align with prior studies in which authors utilised diverse polysaccharide combinations (e.g., alginate, starch, chitosan) to enhance colloidal stability7,8,10. It was demonstrated that chitosan, as a stabilising encapsulant, exhibits superior efficiency compared to sodium alginate, particularly in terms of encapsulation yield8.
Fig. 4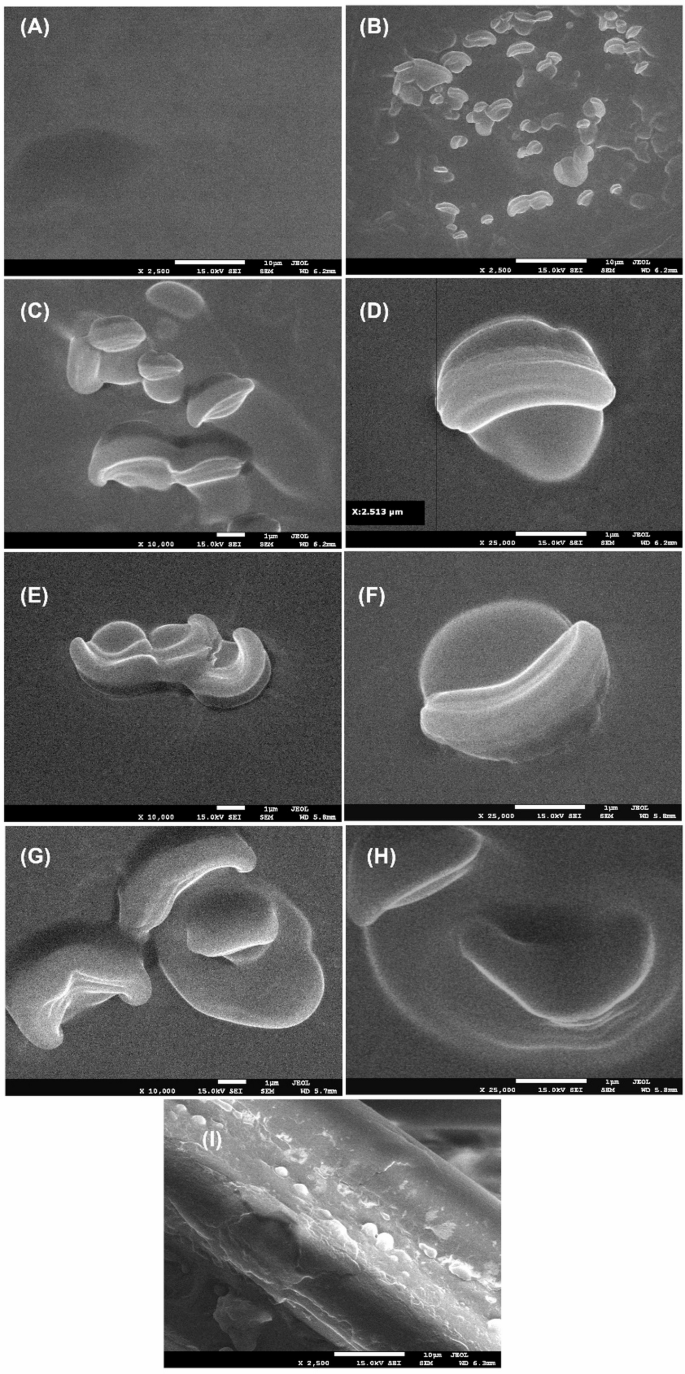
SEM analysis of control (SIV1, A), beeswax capsule modified samples (SIV2, B–D; SIV3, E, F; SIV4, G, H) and cross-section for sample SIV2 (I).
At the molecular level, interactions between beeswax and chitosan can occur through several mechanisms that affect the physicochemical and functional properties of the resulting complexes or composites. Beeswax is a mixture of hydrophobic compounds (mainly fatty acid esters and hydrocarbons), and is soluble in oils. Chitosan, conversely, is hydrophilic due to the presence of amino (–NH2) and hydroxyl (–OH) groups, and undergoes protonation (the transition from –NH2 to –NH3+) in an acidic environment, which gives it a positive charge. Following sonication, the wax molecules, dissolved in the oil, form an emulsion. Subsequently, a layer of chitosan is formed around the nanoemulsion droplets, thereby stabilising the wax/oil emulsions and forming capsules with a hydrophobic core (wax/oil) and a polymer coating (chitosan).Results from electron microscopy and FTIR-ATR studies confirm the proposed nanocapsule structure (Fig. 1): a hydrophobic core (beeswax and olive oil) stabilised by hydrophobic interactions, encapsulated within a chitosan coating that maintains spherical integrity via hydrogen bonding. This is corroborated by FTIR-ATR spectra, which reveal molecular interactions between components through peak shifts and intensity changes—notably, reduced absorption of –OH/–NH2 groups at 3257 cm−1 and altered bands at 2915 cm−1 (C–H asym. stretch), 2849 cm−1 (C–H sym. stretch), and 1744 cm−1 (C = O ester stretch).
Particle size and zeta potential analysis
The zeta potential (ζ) is employed as a means of ascertaining the stability of the resulting nanoparticles. As the absolute value of the zeta potential increases, the dispersion properties of colloidal particles are enhanced, while simultaneously, electrostatic repulsion forces are intensified. As the zeta potential approaches zero, the particles become increasingly unstable, leading to a greater propensity for aggregation. It is hypothesised that a result above ± 30 mV indicates that the test sample is stable73. The measurement results for individual samples containing beeswax nanocapsules and olive oil were 80 mV, 90 mV, 85 mV and 95 mV for samples SIV1, SIV2, SIV3 and SIV4, respectively. A comparable potential value is observed for chitosan dissolved in acetic acid74. The measurement graphs are presented in the supplementary materials (Fig. S1). The zeta potential values for all samples are high, indicating that the system is stable. The generation of nanocapsules in the chitosan matrix resulted in a slight increase in zeta potential values compared to the control sample. This is likely due to the involvement of chitosan chains in stabilising the surface of the nanoemulsion. In order to ascertain the size and distribution of particles present in the gel, dynamic light scattering (DLS) measurements were performed on the resulting gels (Fig. S2). As illustrated in Figure S2, the distribution is depicted in the left column according to particle number and in the right column according to intensity. The observed discrepancies between the number-based size distribution and the intensity-based distribution are attributable to the polydispersity of the sample and the physical basis of DLS detection. The particle size of the control sample (SIV1) was determined to be 10 nm. The application of an ultrasonic homogeniser in an acetic acid medium resulted in the dispersion of chitosan chains, leading to the formation of nanometric structures. Upon the addition of the initial portion of the beeswax/oil nanoemulsion (sample SIV2), two fractions were observed, with a diameter of 10 nm and 100 nm, respectively. The fraction of 10 nm in diameter was predominant, indicating the formation of nanocapsules with a diameter of 100 nm within the chitosan gel. Upon the addition of a further portion of the nanoemulsion (SIV3), the proportion of particles measuring 100 nm in diameter increased, and these smaller particles were no longer observed. Additionally, a minor population of particles with a diameter of 400 nm was discerned. In sample SIV4, where the largest portion of nanoemulsion was added, particles of 100 nm in size also predominated, but the formation of aggregates of 3000 nm in size was observed. The control sample SIV1 exhibits the lowest polydispersity index (PDI) of 0.28, indicating the most homogeneous particle size distribution. In contrast, samples SIV3 (0.45), SIV2 (0.46), and SIV4 (0.47) display progressively higher PDI values, reflecting increased polydispersity. This trend is likely attributable to the presence of aggregates in these samples. The particle size, as determined by scanning electron microscopy, was found to be within the range of 500 to 1500 nm, while the average particle size, as determined by DLS, was observed to be significantly smaller. This discrepancy may be attributed to the partial aggregation of the particles during the drying process and the deformation of the nanocapsules under the electron beam and vacuum conditions employed for SEM measurements.
Mechanical properties of composite films
Table 3 illustrates the thickness of the films and their corresponding mechanical properties. As can be seen from the data presented, the values of the mechanical parameters of the composite films showed considerable variability. As the amount of beeswax contained in the film increased, so did its thickness. An increase in thickness compared to the control sample (SIV1) by 36–76% was recorded. However, this increase in thickness was accompanied by a 24–62% decrease in film strength. Little variation was observed in the elongation at break parameter. As indicated by the extant literature, the tensile strength (TS) of chitosan composite films is comparable to that of commercial synthetic films, such as HDPE (22–23 MPa) and LDPE (19–44 MPa)75. The obtained composites demonstrated greater strength than potato starch-chitosan films with incorporated quantum dots of zinc sulfide and cadmium sulfide (4.6–5.7 MPa)76, as well as the kudzu starch-chitosan solution with dissolved chitosan in malic acid (10.13 MPa)77. Conversely, the composites produced in this study exhibited a lower tensile strength when compared to cellulose-chitosan composites (> 50 MPa)78. Krystyan et al.34 observed that the thickness of starch/chitosan composites incorporating carbon quantum dots (CQDs) does not always correlate with their breaking strength. In the authors’ study, the thin composites demonstrated a 2.5-fold increase in resistance to fracture compared to their thicker counterparts. It has been hypothesised that significantly more robust intermolecular forces are present in thin composites. This is believed to be the reason for their enhanced resistance to breakage. It is also noteworthy that the incorporation of hydrophobic substances into the composition of composites can result in a reduction in breaking strength. However, this is counterbalanced by a concomitant enhancement in the elasticity of the material. The extensibility of the tested composites was comparable to starch/chitosan polymer composites modified by graphene oxide (59.23–66.52%)34, which may be due to the presence of both glycerol and olive oil in the formulation. However, it has been confirmed that while plasticisers have a positive effect on the strength and tensile properties of films by reducing intermolecular friction between the polymer chains79, excessive amounts can have the opposite effect80. As the concentration of glycerol increases, it has been observed to migrate to the surface of the composite, resulting in a sticky texture81.
Table 3 Mechanical properties of the obtained films.
In light of the findings, it is imperative that subsequent utilisation of the composites incorporates a consideration of their modest breaking strength, whilst acknowledging their commendable elongation properties. In scenarios where these parameters may be of paramount importance, it has been demonstrated that the SIV1 composite exhibits the optimal mechanical characteristics among the materials that have been examined.
Contact angles and surface free energy of composite films
The additional hydrophobicity measurements and surface free energy (SFE) evaluations were performed for studied samples. These analysis are pivotal in the evaluation of solid biopolymers, especially in biomedical and food production fields7,9. By determining the hydrophilicity and SFE assessments enable us to tailor the material properties for enhanced biocompatibility and performance of potential interactions with biological fluids.
The matrix (control sample—SIV1) of chitosan gel is characterized by high hydrophobicity, which is mainly responsible for dispersive interactions, with a small contribution of polar interactions (Table 4). The addition of beeswax to the chitosan gel matrix increases the value of surface free energy by way of a marked increase in surface dispersive interactions, while polar interactions virtually disappear. The impact of augmented dispersion interactions is already discernible in the sample exhibiting the lowest beeswax content (SIV2). Further increases in concentration result in minimal changes, amounting to a few units of surface free energy.
Table 4 Wetting angles and the values of free surface energy.Antibacterial activity
Skin swabs allowed to gather a total of 35 Gram-positive cocci, mostly belonging to the genus Staphylococcus. Detailed characteristics of the strains, including their origin, growth inhibition caused by the reference antibiotics, which are cefoxitin (FOX 30 µg), erythromycin (E 15 µg) and clindamycin (DA 2 µg), type of resistance (methicillin resistance, MLSb type of resistance) and reaction to emulsions containing beeswax biocomposites is provided in Table S1.
The bacterial strains isolated from skin lesions were identified mostly as Staphylococcus spp., including the following species: S. aureus, S. warneri, S. haemolyticus, S. simulans, S. epidermidis, S. borealis, S. lugdunensis and S. schleiferi. They showed a variety of resistance mechanisms. The highest share of resistance was observed in the case of erythromycin (47.6%), followed by clindamycin (38.1%) and cefoxitin, which determined the methicillin resistance of strains (28.6%). As many as 66.7% of lesions-derived strains showed some type of MLS resistance. On the other hand, Staphylococcus spp. isolated from healthy human skin, i.e. from hands and under eye region, were all susceptible to erythromycin, one strain (7.7%) was resistant to cefoxitin and two strains (15.4%) were resistant to clindamycin.
Antibacterial activity of the prepared biocomposites was examined in two stages. First, all four (SIV1-SIV4) concentrations were applied along with individual reagents (i.e. chitosan, beeswax and olive oil) in order to verify whether there is a synergistic antibacterial action between the examined components and to assess the most effective concentration of the examined composites in terms of their antibacterial properties. Due to the fact that the interpretative criteria are not available for the examined type of formulations, the arbitrary criteria were adopted to determine the most effective concentration, which we assumed to be the concentration that inhibited the growth of the highest share of strains. And so, the growth of five out of 11 bacterial strains was inhibited by the SIV4 emulsion, while SIV3 inhibited the growth of three strains, whereas SIV2 and SIV 1 caused very small growth inhibition zone in the case of S. aureus type strain ATCC 25923 only. For this reason, the SIV4 was selected as the most effective one, i.e. this concentration was selected as MIC. Interestingly, in the case of Streptococcus dysgalactiae, similar growth inhibition was observed in the case of olive oil (16 mm) and SIV4 biocomposite (17 mm). The other biocomposite concentrations did not inhibit the growth of this strain. The results of antibacterial activity determination tests are shown in Fig. 5.
Fig. 5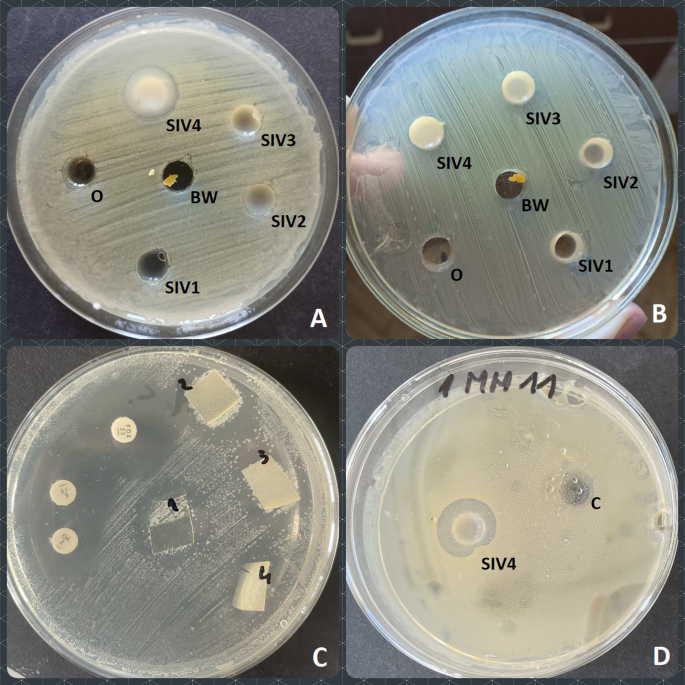
Reaction of the examined bacterial strains to the biocomposite emulsions. (A) Escherichia coli ATCC 25922 tested against SIV1-SIV4 emulsions and olive oil (O) and beeswax (BW) as controls; (B) Staphylococcus aureus ATCC 25923 tested against SIV1-SIV4 emulsions and olive oil (O) and beeswax (BW) as controls; (C) Staphylococcus spp. tested against SIV1-SIV4 foils and antibiotics (DA, E, FOX discs); (D) Staphylococcus epidermidis tested against SIV4 emulsion and control emulsion with no beeswax added (C).
In the second stage of antibacterial activity tests, the SIV4 biocomposite and chitosan were examined against 36 Gram-positive cocci. Seven out of 22 lesions-derived strains (i.e. 31.8%) reacted to the application of beeswax biocomposite-containing emulsions and the growth inhibition zones ranged from 10 to 14 mm (Table S2). Importantly, the growth of the only methicillin resistant S. aureus identified in this study was inhibited by the application of beeswax emulsion (Table S2). Growth inhibition was also observed in the case of all-susceptible S. warneri, S. haemolyticus (MLSb constitutive type of resistance), lincosamide-resistant S. simulans, S. epidermidis (methicillin resistant, MLSb constitutive) and Arthrobacter woluwensis (methicillin resistant). The growth of five out of 13 (38.5%) Staphylococcus spp. strains isolated from healthy skin was inhibited by the beeswax biocomposite emulsion and the growth inhibition zone was 10–11 mm. When the mean growth inhibition zone of all strains are considered, the values are similar between the strains isolated from skin lesions (mean 3.1 mm, std. dev. 5.21) and typical skin microbiota (mean 3.9 mm, std. dev. 5.2). However, when only these inhibited were considered, the mean value of growth inhibition for Gram-positive cocci isolated from skin lesions was 11.3 mm (std. dev. 1.5), while for skin microbiota it was 10.2 (std. dev. 0.44).
The differences in cell wall composition, cell wall proteins and cell metabolism may be the reason for the observed differences in the bacterial reactions to the applied formulations82. Similarly to our study, some researchers reported mild antimicrobial activity of beeswax extracts against Gram-positive and Gram-negative bacteria, as well as against Candida yeasts and Aspergillus fungi83. Hong84 examined antibacterial properties of emulsified Manuka beeswax against S. aureus, S. epidermidis and E. coli, but did not observe growth reduction in agar well diffusion assay, or emulsion-direct contact. The only effective formulation however, did not pass the sensory tests. For this reason, it may become challenging to obtain highly effective antibacterial agent containing beeswax that would be characterized with high scores of texture and sensory properties. However, what needs to be mentioned here, is that the beeswax-containing biocomposites examined in this study are novel agents, in which the synergism of the three components, i.e. beeswax, olive oil and chitosan, could be the reason for the observed bacterial reactions in the presented experiments, but still the antibacterial activity reported herein cannot be assessed as strong. On the other hand, the mild antibacterial effect that was observed in our study may become useful in production of skincare or cosmetic products that should not damage the natural skin microbiota of their users.
In conclusion, the obtained composites demonstrated selective antimicrobial efficacy against specific pathogens. The methodology for the synthesis of composite materials containing capsules allows for the straightforward incorporation of additional bioactive components into the model system, thereby enhancing the overall antimicrobial efficacy.
Dining and Cooking