

Study design
A four-week controlled experiment was conducted during lunch hours in a university cafeteria (Dijon, France), serving approximately 2000 meals per lunchtime. The experiment comprised two phases (Fig. 1): a two-week control period with the aim of serving 25% of vegetarian main meals consistently with the observed availability in this cafeteria before the experiment and a two-week intervention period with the aim of serving 50% of vegetarian main meals. The vegetarian main meals excluded meat and fish but might include eggs and/or dairy products. The data were collected during both the control and the intervention periods to conduct pre-and post-data analysis.
Fig. 1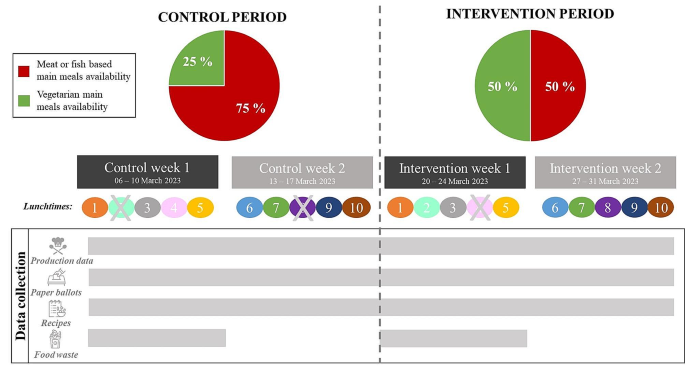
Experimental design for modification of the availability of vegetarian meals intervention and data collection procedure
Legend: Grey crosses depict days when data collection could not be carried due to strike actions led by the university cafeteria staff. The same food items were offered on days with the same color and number in the control and intervention period (except for the increase in vegetarian main meals)
Production data: Vegetarian main meal availability (%) and percentage of chosen vegetarian main meals (%)
Paper ballots: Satisfaction score (range [1;5]) and liking score (range [1;5])
Recipes: Nutritional quality, environmental impact and cost of production of chosen main meals
Food waste: Weight of leftovers on the plates
Both the control and intervention periods included ten lunchtimes matched for recipes of the main meals, starters, and desserts to obtain ten “control-intervention” paired lunchtimes. Doubling the proportion of vegetarian main meals was achieved both by increasing the number of servings for each vegetarian main meal and by substituting one meat based main meal with a vegetarian main meal. Between 1 and 2 vegetarian options were served per lunchtime during the control period, and between 2 and 3 during the intervention period but the initial number of options remained similar (n = 5 or 6) resulting in a net reduction of meat options. All the menus for the main meals served during the experiment are presented in supplementary materials (S1). During the four weeks of the experiment, we ensured that a vegetarian and a nonvegetarian main meal option were always available until the end of the lunchtime. Students were not informed of the change in the food offered before or during the experiment and were not compensated for their participation. The study design was initially proposed by the research team and then discussed and codeveloped with the university cafeteria staff; details on the co-construction process are provided in supplementary materials (S2). The protocol resulting from this co-construction process was approved by the CEEI-IRB ethical committee for research (reference: n◦23–976, delivered on January 10th, 2023).
MeasuresMain meal choices
The university cafeteria was on 3 floors and 5 or 6 different main meals were served every day, all at the same price for the students. The students could only choose one of them. At the entrance, a digital board displayed the description of all the 6 main meals and at which floors they were available. The university cafeteria staff were free to serve the vegetarian main meals on the different floors which may vary from one day to another. On each floor, the students could see the available options in trays and were served to order.
Every lunchtime during the experiment and for each main meal option, university cafeteria staff recorded the number of servings produced and servings remaining. The availability of vegetarian main meals was calculated as the number of vegetarian servings produced over the total number of servings produced (in %) which represents the average probability of vegetarian meals availability across one lunchtime. The number of vegetarian and nonvegetarian main meal choices was calculated as the difference between the number of servings produced and servings remaining for each main meal option.
Main meal offer satisfaction and liking
Every lunchtime during the experiment, anonymous paper ballots were handed out to all the students who ate at the university cafeteria by a team of five experimenters at the checkout counters. Students were asked to answer the questions on the ballots and to place them back in a box near the cafeteria exit. Alternatively, students had the option to answer the same questions online using QR codes positioned on each cafeteria table and linked to the Lime Survey© platform. Students were informed orally and through posters that we were conducting a study regarding how much they liked the food at the university cafeteria and were free to decide whether to take part or not for each lunchtime. The ballot design is presented in the supplementary materials (S3). The survey comprised four questions: “Are you satisfied with the food that was offered today?”, ranging from 1 “not at all satisfied” to 5 “very satisfied” (meal offer satisfaction score) and “Which main meal did you have today?” to select from the list of the main meals available on the day, “How much did you like the main meal you had today?” on a scale ranging from 1 “I did not like it at all” to 5 “I truly liked it” (liking score) and “At what time were you served?”.
Food waste
Food waste was measured on a subsample of lunchtimes (n = 8, 4 during the control period and 4 during the intervention period) as an additional, nondeclarative measure of the acceptability of the increased availability of vegetarian main meals. Previous research has indicated that food waste is a reliable indicator of meal preferences and overall satisfaction with food [33, 34]. During the first and third experimental weeks, university cafeteria staff members asked all the students to place leftovers from their main meals, starters/desserts, and breads into three separate bins. Food weight data (in g/day) were recorded by university cafeteria staff.
Sustainability indicators
Measures of satisfaction, liking and food waste address the sociocultural aspect of sustainability, but food sustainability also includes nutritional, environmental, and socioeconomic dimensions [5, 6]. To assess whether increasing the availability of vegetarian main meals improved the overall sustainability of students’ food choices and fill a research gap regarding those aspects [31], we calculated three indicators: nutritional quality, GHGE and cost of production. They were calculated based on actual recipes for each main meal retrieved from the university cafeteria informatic system. For each lunchtime, we computed indicators of nutritional quality, environmental impact and cost averaged across all main meals weighted by the number of meals chosen. All the indicators for each main meal are given in supplementary materials (S4).
Nutritional quality
To estimate the nutritional composition of each of the ingredients composing the 63 main meals served during the experiment, we used two French food nutrient reference tables: Ciqual 2020 and Calnut 2020. We then assessed the nutritional quality of the main meals using the FSA score (the British Food Standards Agency nutrient profiling system) based on the allocation of positive and negative points for respectively unfavorable nutrients (energy, saturated fatty acids, total sugar and sodium) and favorable nutrients or food groups (protein, fiber, fruits, vegetables, legumes and nuts), respectively, and calculated the FSA score per 100 g [35]. We used the updated version of the FSA algorithm and obtained scores ranging from − 17 to 55, with higher scores indicating poorer nutritional quality [36].
To determine the average nutritional quality of the choices made during one lunchtime, we calculated the average FSA score for all main meals served during this lunchtime weighted by the number of servings actually chosen (i.e., production – leftovers).
Environmental impact
The environmental impact of the main meals was estimated as the GHGE because they are strongly correlated with the Environmental Footprint single score, an aggregated environmental impact score developed by the European Commission [37]. Additionally, GHGE are the most reliable environmental indicator available in French food databases [38]. The GHGE data for each of the ingredients composing the main meals served during the experiment were retrieved from the Agribalyse database [38], the French food environmental impact database based on life cycle analysis drawn up by the French Agency for Ecological Transition, which includes GHGE values in kg of CO2e/kg for 2480 foods. We then calculated the GHGE for one serving of each of the 63 main meals.
To determine the average environmental footprint of the choices made during one lunchtime, we calculated the average GHGE for all main meals served during this lunchtime weighted by the number of servings actually chosen (i.e., production – leftovers).
Cost of production
The cost (in €) of one serving of a main meal was computed automatically on the university cafeteria’s informatic system and was retrieved for the 63 main meals served. From these data, we determined the average cost of the choices made during one lunchtime by calculating the average cost for all main meals served during this lunchtime weighted by the number of servings actually chosen (i.e., production – leftovers).
Additional measures: feedback questionnaire
During the last two lunchtimes of the study (March 30th and 31st, 2023) and the following lunchtime (April 3rd, 2023), we handed out QR codes linked to an anonymous online questionnaire to the students in the university cafeteria. The eligibility criteria were to 1/have eaten at the university cafeteria during the experimental period, 2/be older than 18 years of age and, 3/be a student. The questionnaire was hosted on the Lime Survey© platform and lasted approximately 5 min. Students were asked for their feedback on the food offered during the past two weeks. We assessed whether they had noticed any changes by asking them “Have you noticed any changes in the main meals offered during lunchtimes over the past two weeks?“. If the participants responded affirmatively, then we asked them to describe what they had observed using free text. Two independent researchers coded whether a participant guessed that there was a change regarding vegetarian main meals. We then told the participants that there was a twofold increase in the availability of vegetarian main meals during the last two weeks and asked them to indicate whether they had the impression of having eaten more vegetarian main meals; if so, we asked them to rate the level of constraint on a scale from 1 (“not burdensome at all”) to 10 (“highly burdensome”). Finally, sociodemographic characteristics were measured: age, sex, scholarship status, type of educational institution, field of study, highest educational qualification obtained, place of living and declared diet (i.e., omnivorous, flexitarian, pesco-vegetarian, ovo-lacto-vegetarian, or vegan).
Statistical analyses
We followed a preregistered analysis plan (https://osf.io/pf3x7/) and slight deviations are explained below. All analyses were conducted for 17 lunchtimes, as data collection could not be carried out for two lunchtimes during the control period and one lunchtime during the intervention period due to strike actions. We first analysed the effect of the intervention (predictor: control, intervention) on the choice of vegetarian main meals by students (outcome: 0 for non-vegetarian, 1 for vegetarian, binomial distribution) using a generalized linear mixed model that included lunchtimes as a random effect to consider the pairing between the control and intervention periods (n = 10). For descriptive purposes, we calculated and represented the correlation between the availability of vegetarian main meals (%) and vegetarian main meal choices (%) for each lunchtime (n = 17). Due to strike actions that led to only having seven pairs of lunchtimes, we will not report results from the preregistered secondary analysis, which aimed to estimate the relationship between the increase in the availability of vegetarian main meals and the increase in the odds of choosing a vegetarian main meal.
We then evaluated the effect of the intervention (predictor: control, intervention period) on students’ meal offer satisfaction and liking (outcomes: scores from 1 to 5) using generalized linear mixed models that included lunchtimes as a random effect. Finally, to test whether the intervention differentially affected the liking of vegetarian and nonvegetarian main meals, we analyzed the effect of the intervention (predictor: control, intervention period), the type of main meal (predictor: vegetarian, nonvegetarian) and the interaction between the intervention and the type of main meal on students’ liking (outcome: score from 1 to 5) using a generalized linear mixed model. A random effect of the main meal recipe (e.g., cheese omelet, pork curry) was added to the model to consider the clustering of liking data for the same recipe across lunchtimes. As satisfaction and liking data were obtained from a subsample of students, we verified whether the main meal choices reported on the ballots were representative of the main meals served each lunchtime with chi-square tests. Regarding food waste data (exploratory analyses, not preregistered), we compared average food waste from the main meal between the control and intervention periods using a nonparametric Wilcoxon comparison test (n = 8). Finally, as secondary analyses, we compared the nutritional quality, environmental impact and cost of the main meals chosen between the control and intervention periods using generalized linear mixed models, with intervention as a predictor (control, intervention period) and lunchtime as a random effect.
All the statistical analyses were performed using SAS version 9.4 (SAS Institute, Inc., 2012 SAS® 9.4. Cary, NC) and the level of significance was set at p < 0.05 for all of the analyses.
Sample size rationale
We chose to carry out a four-week study for logistical reasons because we wanted to ensure uninterrupted data collection in the university cafeteria with minimal fluctuations in student attendance. This meant excluding exam periods and school holidays from our study. Additionally, we limited the intervention period to two weeks, as during the co-construction process (described in supplementary materials (S2)), this was mentioned as the longest acceptable timeframe for the chefs to conduct this type of intervention. On each study lunchtime, we expected an attendance of ~ 2,000 students, given the usual sales data for this cafeteria.
Dining and Cooking