

Oct 21, 2025
IndexBox has just published a new report: Latin America and the Caribbean – Olive Oil And Its Fractions – Market Analysis, Forecast, Size, Trends And Insights.
The olive oil market in Latin America and the Caribbean reached 135K tons valued at $1.1B in 2024, with consumption driven by Brazil (48% share). The market is forecast to grow to 160K tons (CAGR +1.6%) and $1.5B (CAGR +2.9%) by 2035. The region relies heavily on imports (112K tons), led by Brazil, while Argentina and Chile are the main producers and exporters. Import prices surged to $9,823 per ton in 2024, reflecting strong demand and market value growth.
Key Findings
Market forecast to reach 160K tons and $1.5B by 2035, growing at CAGRs of +1.6% and +2.9% respectivelyBrazil is the dominant consumer and importer, accounting for 48% of volume and 62% of import valueRegional production is concentrated in Argentina and Chile, which together account for 88% of exportsImport prices surged 35% to $9,823 per ton in 2024, indicating strong value growthChile shows the highest per capita consumption and fastest import growth among major marketsMarket Forecast
Driven by increasing demand for olive oil and its fractions in Latin America and the Caribbean, the market is expected to continue an upward consumption trend over the next decade. Market performance is forecast to decelerate, expanding with an anticipated CAGR of +1.6% for the period from 2024 to 2035, which is projected to bring the market volume to 160K tons by the end of 2035.
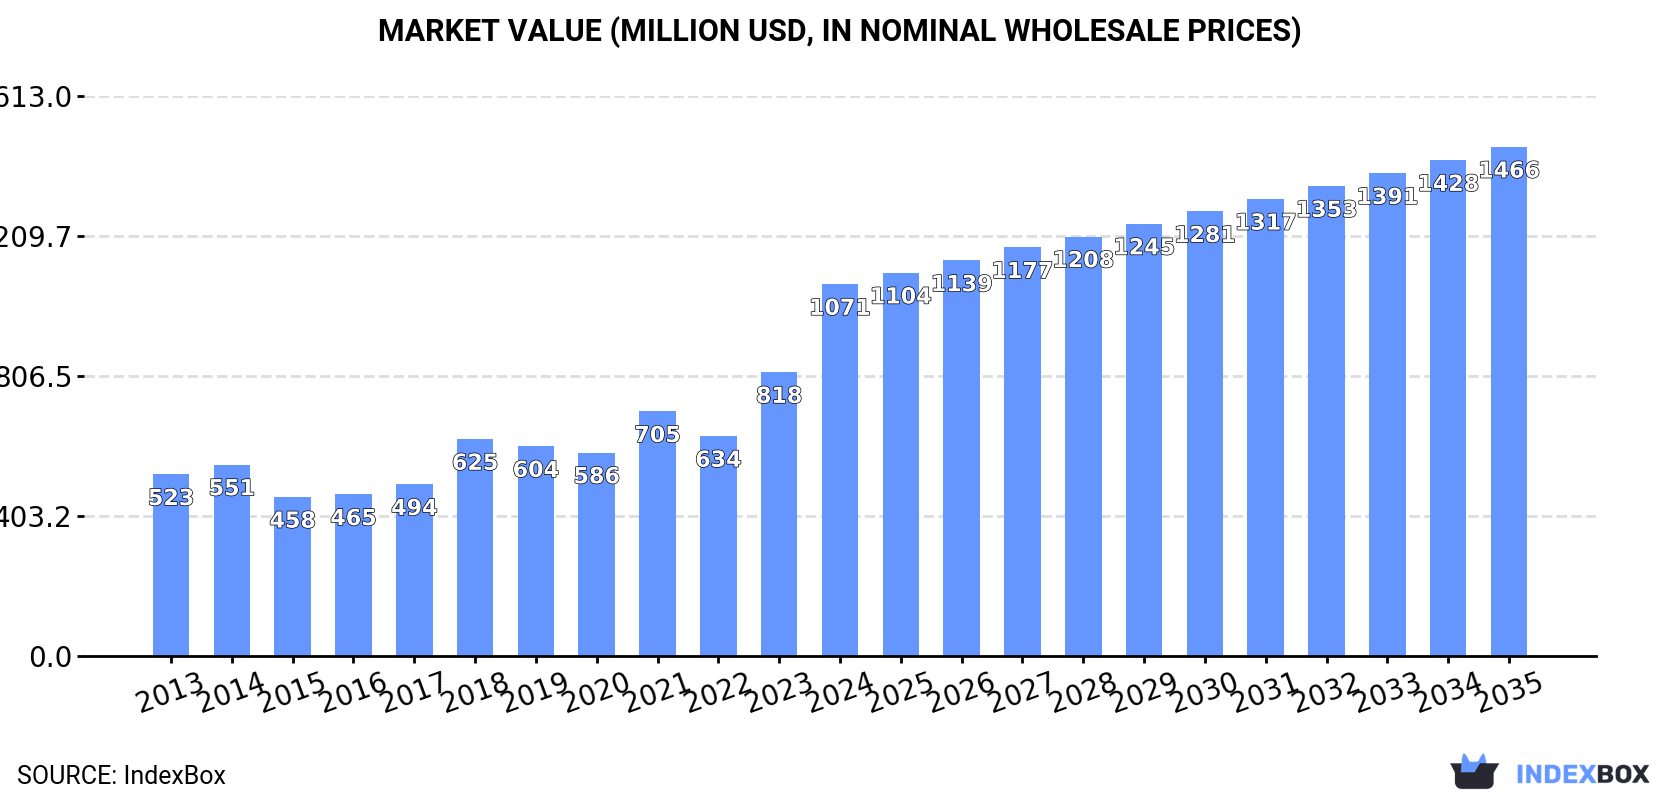
In value terms, the market is forecast to increase with an anticipated CAGR of +2.9% for the period from 2024 to 2035, which is projected to bring the market value to $1.5B (in nominal wholesale prices) by the end of 2035.
 ConsumptionLatin America and the Caribbean’s Consumption of Olive Oil And Its Fractions
In 2024, consumption of olive oil and its fractions in Latin America and the Caribbean expanded sharply to 135K tons, with an increase of 7.1% compared with the previous year. The total consumption volume increased at an average annual rate of +2.6% from 2013 to 2024; however, the trend pattern indicated some noticeable fluctuations being recorded throughout the analyzed period. The volume of consumption peaked at 141K tons in 2021; however, from 2022 to 2024, consumption failed to regain momentum.
The value of the olive oil market in Latin America and the Caribbean soared to $1.1B in 2024, rising by 31% against the previous year. This figure reflects the total revenues of producers and importers (excluding logistics costs, retail marketing costs, and retailers’ margins, which will be included in the final consumer price). Overall, consumption enjoyed buoyant growth. As a result, consumption reached the peak level and is likely to continue growth in the immediate term.
Consumption By Country
Brazil (65K tons) remains the largest olive oil consuming country in Latin America and the Caribbean, accounting for 48% of total volume. Moreover, olive oil consumption in Brazil exceeded the figures recorded by the second-largest consumer, Mexico (17K tons), fourfold. The third position in this ranking was taken by Argentina (14K tons), with a 10% share.
From 2013 to 2024, the average annual rate of growth in terms of volume in Brazil stood at +1.7%. The remaining consuming countries recorded the following average annual rates of consumption growth: Mexico (+5.0% per year) and Argentina (-1.5% per year).
In value terms, Brazil ($585M) led the market, alone. The second position in the ranking was held by Mexico ($151M). It was followed by Argentina.
In Brazil, the olive oil market increased at an average annual rate of +6.2% over the period from 2013-2024. The remaining consuming countries recorded the following average annual rates of market growth: Mexico (+11.1% per year) and Argentina (+3.0% per year).
The countries with the highest levels of olive oil per capita consumption in 2024 were Chile (693 kg per 1000 persons), El Salvador (374 kg per 1000 persons) and Argentina (300 kg per 1000 persons).
From 2013 to 2024, the most notable rate of growth in terms of consumption, amongst the key consuming countries, was attained by Chile (with a CAGR of +10.9%), while consumption for the other leaders experienced more modest paces of growth.
ProductionLatin America and the Caribbean’s Production of Olive Oil And Its Fractions
After five years of growth, production of olive oil and its fractions decreased by -22.3% to 61K tons in 2024. The total production indicated mild growth from 2013 to 2024: its volume increased at an average annual rate of +1.4% over the last eleven years. The trend pattern, however, indicated some noticeable fluctuations being recorded throughout the analyzed period. The pace of growth appeared the most rapid in 2017 when the production volume increased by 54%. Over the period under review, production reached the peak volume at 78K tons in 2023, and then declined remarkably in the following year.
In value terms, olive oil production fell to $415M in 2024 estimated in export price. Overall, production, however, continues to indicate a strong expansion. The most prominent rate of growth was recorded in 2015 with an increase of 115% against the previous year. The level of production peaked at $440M in 2023, and then dropped in the following year.
Production By Country
The countries with the highest volumes of production in 2024 were Argentina (32K tons), Chile (22K tons) and Peru (2.2K tons), with a combined 94% share of total production.
From 2013 to 2024, the most notable rate of growth in terms of production, amongst the leading producing countries, was attained by Peru (with a CAGR of +16.1%), while production for the other leaders experienced more modest paces of growth.
ImportsLatin America and the Caribbean’s Imports of Olive Oil And Its Fractions
In 2024, approx. 112K tons of olive oil and its fractions were imported in Latin America and the Caribbean; increasing by 7.8% against 2023 figures. Total imports indicated a pronounced increase from 2013 to 2024: its volume increased at an average annual rate of +3.0% over the last eleven-year period. The trend pattern, however, indicated some noticeable fluctuations being recorded throughout the analyzed period. Based on 2024 figures, imports increased by +10.2% against 2022 indices. The most prominent rate of growth was recorded in 2018 with an increase of 32% against the previous year. Over the period under review, imports attained the peak figure at 120K tons in 2021; however, from 2022 to 2024, imports failed to regain momentum.
In value terms, olive oil imports soared to $1.1B in 2024. Overall, imports recorded resilient growth. The most prominent rate of growth was recorded in 2023 when imports increased by 47%. Over the period under review, imports reached the maximum in 2024 and are expected to retain growth in the near future.
Imports By Country
Brazil was the major importer of olive oil and its fractions in Latin America and the Caribbean, with the volume of imports recording 66K tons, which was approx. 59% of total imports in 2024. Mexico (17K tons) ranks second in terms of the total imports with a 15% share, followed by Colombia (7.1%) and Chile (4.9%). The Dominican Republic (3K tons) and Ecuador (1.8K tons) followed a long way behind the leaders.
From 2013 to 2024, average annual rates of growth with regard to olive oil imports into Brazil stood at +1.7%. At the same time, Chile (+22.6%), Ecuador (+9.0%), Colombia (+8.4%), Mexico (+4.7%) and the Dominican Republic (+2.8%) displayed positive paces of growth. Moreover, Chile emerged as the fastest-growing importer imported in Latin America and the Caribbean, with a CAGR of +22.6% from 2013-2024. From 2013 to 2024, the share of Chile, Colombia and Mexico increased by +4.2, +3 and +2.4 percentage points, respectively. The shares of the other countries remained relatively stable throughout the analyzed period.
In value terms, Brazil ($676M) constitutes the largest market for imported olive oil and its fractions in Latin America and the Caribbean, comprising 62% of total imports. The second position in the ranking was held by Mexico ($179M), with a 16% share of total imports. It was followed by Colombia, with a 6.2% share.
In Brazil, olive oil imports expanded at an average annual rate of +7.5% over the period from 2013-2024. In the other countries, the average annual rates were as follows: Mexico (+12.7% per year) and Colombia (+15.3% per year).
Import Prices By Country
The import price in Latin America and the Caribbean stood at $9,823 per ton in 2024, with an increase of 35% against the previous year. In general, the import price saw a strong expansion. The most prominent rate of growth was recorded in 2023 when the import price increased by 44% against the previous year. The level of import peaked in 2024 and is expected to retain growth in the immediate term.
Average prices varied somewhat amongst the major importing countries. In 2024, major importing countries recorded the following prices: in Mexico ($10,801 per ton) and Ecuador ($10,446 per ton), while Chile ($8,249 per ton) and Colombia ($8,577 per ton) were amongst the lowest.
From 2013 to 2024, the most notable rate of growth in terms of prices was attained by the Dominican Republic (+9.1%), while the other leaders experienced more modest paces of growth.
ExportsLatin America and the Caribbean’s Exports of Olive Oil And Its Fractions
In 2024, overseas shipments of olive oil and its fractions decreased by -32.9% to 37K tons for the first time since 2021, thus ending a two-year rising trend. Total exports indicated a mild expansion from 2013 to 2024: its volume increased at an average annual rate of +1.7% over the last eleven-year period. The trend pattern, however, indicated some noticeable fluctuations being recorded throughout the analyzed period. The growth pace was the most rapid in 2015 with an increase of 104% against the previous year. Over the period under review, the exports hit record highs at 55K tons in 2023, and then contracted rapidly in the following year.
In value terms, olive oil exports contracted to $297M in 2024. In general, exports, however, saw a buoyant increase. The growth pace was the most rapid in 2017 when exports increased by 103%. Over the period under review, the exports attained the maximum at $348M in 2023, and then dropped in the following year.
Exports By Country
Argentina (18K tons) and Chile (14K tons) dominates exports structure, together creating 88% of total exports. It was distantly followed by Peru (3K tons), making up an 8.1% share of total exports. Mexico (694 tons) followed a long way behind the leaders.
From 2013 to 2024, the most notable rate of growth in terms of shipments, amongst the leading exporting countries, was attained by Peru (with a CAGR of +16.8%), while the other leaders experienced more modest paces of growth.
In value terms, Argentina ($144M), Chile ($131M) and Peru ($9.5M) were the countries with the highest levels of exports in 2024, with a combined 96% share of total exports.
Peru, with a CAGR of +15.3%, saw the highest rates of growth with regard to the value of exports, in terms of the main exporting countries over the period under review, while shipments for the other leaders experienced more modest paces of growth.
Export Prices By Country
The export price in Latin America and the Caribbean stood at $7,988 per ton in 2024, surging by 27% against the previous year. In general, the export price recorded a prominent increase. The growth pace was the most rapid in 2023 when the export price increased by 50% against the previous year. Over the period under review, the export prices hit record highs in 2024 and is expected to retain growth in years to come.
Prices varied noticeably by country of origin: amid the top suppliers, the country with the highest price was Mexico ($10,882 per ton), while Peru ($3,170 per ton) was amongst the lowest.
From 2013 to 2024, the most notable rate of growth in terms of prices was attained by Mexico (+11.7%), while the other leaders experienced more modest paces of growth.
Source: IndexBox Market Intelligence Platform
Dining and Cooking