
Sample description
Each record entered into the database was associated with the original sample name used by the authors of the source paper (Original sample name) (e.g., Table 1). To ensure consistency in the descriptions of the samples, the nomenclature of both samples at the base of the trophic web (i.e., organic matter sources, primary producers, plankton, and meiofauna) and of higher-order consumers was standardized. For the former, each entry was assigned to a representative macrocategory (Functional category), intended to improve the practical use of the database. For the latter, based on the scientific name or taxonomic information provided by the source, an updated and standardised taxonomic classification was compiled by referring to the World Register of Marine Species (WoRMS; http://www.marinespecies.org/; Phylum, Class, Order, Family, Genus, Species). The species were classified based on the most detailed taxonomic level mentioned in the respective manuscript.
When available, information about the variables Sex, Maturity, Size (in cm, as reported in the Size type), and Weight (fresh wet weight, in g) was recorded for consumers. Finally, information was provided about sample preparation and pre-treatment prior to isotopic analysis. The last four columns provide insights into the analysed body part or tissue (Tissue), the representativeness of the samples (Pooled samples/replications), and any sample pre-treatments for removing lipids and carbonates (Sample delipidisation, Sample acidification). Lipids and carbonates can affect δ13C values31,32; therefore, some samples may have undergone delipidization or acid decarbonization before isotopic analysis. Alternatively, effect of lipids on δ13C values might have been corrected a posteriori through mathematical equations31,32,33,34,35. When authors reported both pre- and post-delipidisation δ13C values, we exclusively annotated the lipid-adjusted values.
Sampling site and time description
The geographical coordinates of the sampling sites listed in the source papers for each data entry (converted to decimal degrees; Latitude, Longitude) were also reported. When the source papers report multipoint-sampling surveys within a limited area or broadly identify the study location (e.g., via toponymy), the midpoint coordinates of the indicated region were entered. Based on the geographical coordinates, the columns related to the IHO (International Hydrographic Organization) Sea Area, Marine Strategy Framework Directive (MSFD) subregion, and the FAO (Food and Agriculture Organization) subarea were compiled. Indication regarding the sampling depth was also annotated (Sampling depth).
We supplemented the sampling site description with information about the presence of anthropic pressures (e.g., the occurrence of fish farms, chemical pollution) or particular conditions (e.g., river dilution, protected areas) when considered relevant for interpreting the isotopic data (Anthropic pressure or natural condition). Source papers were designed for various distant research scopes and, therefore, they can intentionally focus on areas where specific sources and dynamics influence δ13C and δ15N values. This information was compiled based on the authors’ description of the sampling area.
Finally, records were complemented with the sampling time information when available (Year, Season). While the year was reported according to the format used in the source paper (i.e., single year, multiple years, ranges), the seasonal data were standardised into quarters.
Isotopic characterisation
The δ13C and δ15N values were extracted from the papers’ main text, tables, graphs, or supplementary materials; the associated errors were entered into separate columns, with the indication of the error type (δ13C, δ13C – error, δ13C – error type, δ15N, δ15N – error, δ15N – error type). We also collected the organic carbon (after acidification, specified in the database) to total nitrogen ratio (C/N) when available (C/N, C/N – error, C/N – error type). Whenever relevant, additional details were provided in the last column Notes.
Spatial and taxonomic coverage
Once subjected to quality control procedures, the final dataset consisted of 4,959 georeferenced records of occurrence spread throughout the Mediterranean Sea, spanning a period of 35 years (1983–2018). It is freely accessible for download from SEANOE, a permanent repository hosting sea-related open data, and it adheres to the FAIR principles of Findability, Accessibility, Interoperability, and Reusability of data.
Most records (n = 3,674) were referred to the Western Mediterranean subregion, followed by the Adriatic Sea (n = 619), the Aegean-Levantine Sea (n = 431), and the Ionian Sea and Central Mediterranean Sea (n = 235) (e.g., Fig. 1).
Fig. 1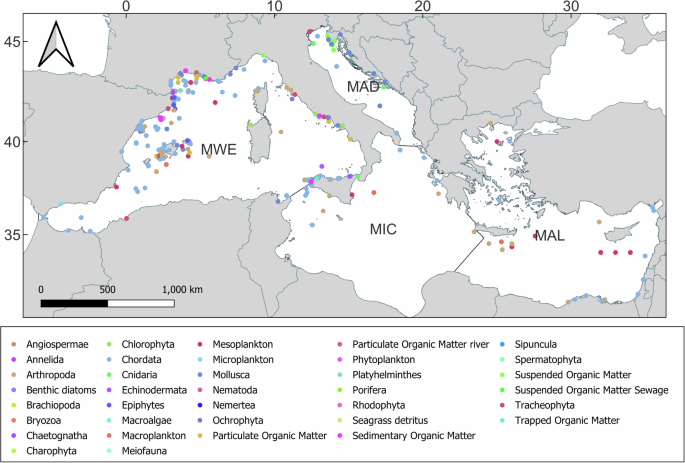
Maps of the georeferenced records of ISOMED for the 4 Mediterranean subregions according to MSFD division: (a) Western Mediterranean Sea; (b) Adriatic Sea, Ionian Sea and Central Mediterranean Sea (the two subregions are represented together); (c) Aegean and Levantine Sea.
The dataset encompasses data covering the entire food web, ranging from basal sources (e.g., Suspended Organic Matter, Sedimentary Organic Matter, phytoplankton, or macrophytes, as shown in Fig. 1) to marine mammals (e.g., the monk seal, Monachus monachus) and birds (e.g., the Scopoli’s shearwater, Calonectris diomedea). Data concerning the basal source and lower-order consumers accounts for 29% of entries (1,429 records), while that referring to higher-order consumers makes up the remaining 71% (3,530 records). The distribution of records across key macrocategories and phyla within these two groups is illustrated in Figs. 2 and 3, respectively.
Fig. 2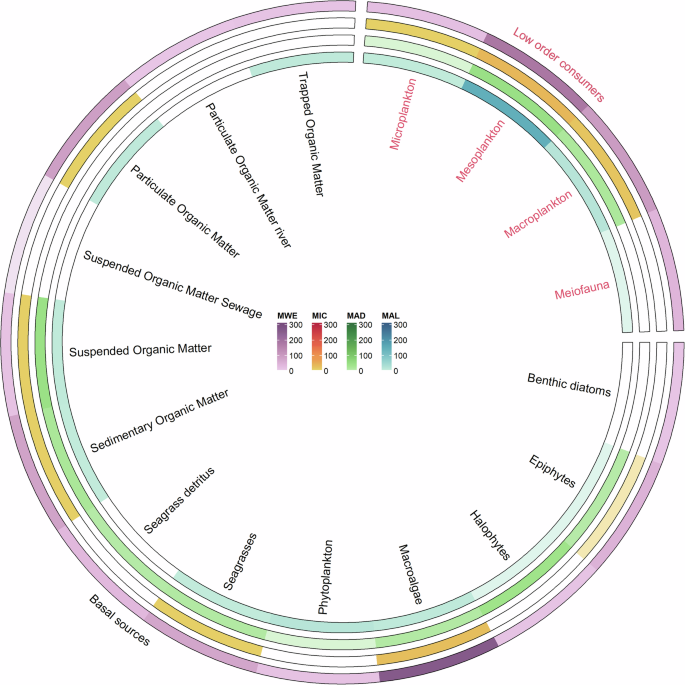
Circular heat map showing the frequency of isotopic data available for basal sources and low-order consumers organised into functional categories. Each ring corresponds to a different MSFD subregion (MWE: Western Mediterranean Sea subregion; MAD: Adriatic Sea; MAL: Aegean-Levantine Sea; MIC: Ionian Sea and Central Mediterranean Sea). The scale of colours indicates the number of data available.
Fig. 3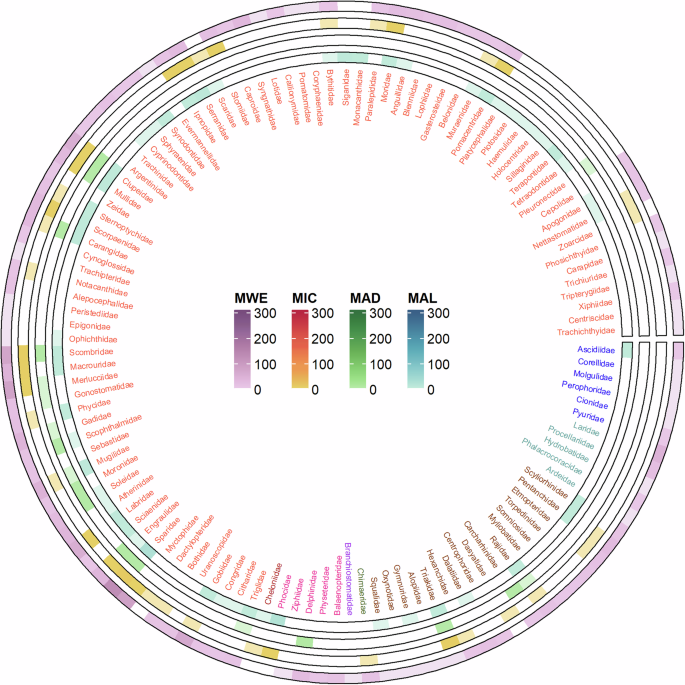
Circular heat map showing the frequency of isotopic data available for higher order consumers: Chordata. Colours refer to different classes. Each ring corresponds to a different MSFD subregion (MWE: Western Mediterranean Sea; MAD: Adriatic Sea; MAL: Aegean-Levantine Sea; MIC: the Ionian Sea and Central Mediterranean Sea; MWE: Western Mediterranean Sea). The scale of colours indicates the number of data available.
As presented in Fig. 2, ISOMED describes the base of the Mediterranean food web by incorporating 593 data points of various size-range planktonic organisms, along with 836 records referring to plant and algae species (both as alive organisms and detritus), as well as several types of organic matter samples (e.g., suspended, particulate organic matter, trapped organic matter). The majority of this data refers to the Western Mediterranean Sea subregion (MWE, 67%), with smaller proportions referring to the Aegean-Levantine Sea (MAL, 14%), the Adriatic Sea (MAD, 12%), and the Ionian Sea and Central Mediterranean Sea (MIC, 7%).
Concerning the higher order consumers’ data, a slight majority of data refer to Chordata (1854 records, 128 families; Fig. 3), whereas invertebrates accounted to 1657 records (Fig. 4), with records mostly belonging to Arthropoda (659 records, 88 families) and Mollusca (551 records, 75 families). The relative representation of these phyla is quite similar in the Western Mediterranean Sea (MWE) and in the Ionian Sea and Central Mediterranean Sea (MIC), with Chordata accounting for 57% and 62%, and Mollusca for 13% and 11%, respectively. Additionally, in the Adriatic Sea (MAD) and Aegean-Levantine Sea (MAL), the relative abundance of data for Chordata is 10% and 77%, 21% and 10% for Arthropoda, and 40% and 7% for Mollusca. Less than 1% of records are available for five phyla, cumulatively accounting for 1.4% of higher-order consumer records. These phyla are Sipuncula, Brachiopoda, Nemertea, Platyhelminthes, and Porifera.
Fig. 4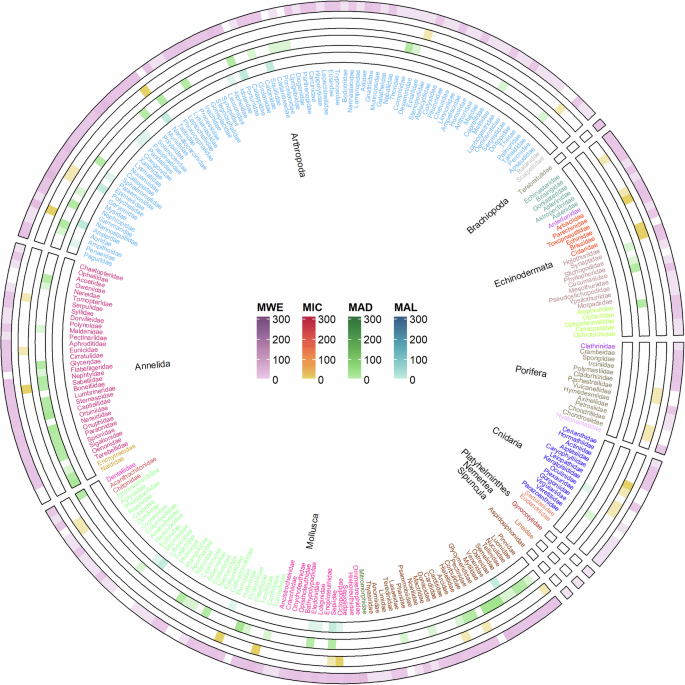
Circular heat map showing the frequency of isotopic data available for higher order consumers, organised into Phyla: invertebrates. Within each Phylum, colours refer to different classes. Each ring corresponds to a different MSFD subregion (MWE: Western Mediterranean Sea; MAD: Adriatic Sea; MAL: Aegean-Levantine Sea; MIC: the Ionian Sea and Central Mediterranean Sea; MWE: Western Mediterranean Sea). The scale of colours indicates the number of data available.
Dining and Cooking