

Exposure to each food additive in adults and children
A total of 3,456 participants were included in this study, comprising 2,177 adults (mean age: 47.6 years, Standard Error (SE) = 0.5; 52.4% female) and 1,279 children (mean age: 11.3 years, SE = 0.13; 50.4% female); their characteristics are displayed in Table 1. Ultra-processed foods (NOVA 4) accounted for a mean of 34.2% (SE = 0.003) of daily energy intake in adults and 49.3% (SE = 0.003) in children. Figure 1 shows the percentage of consumers for each food additive consumed by at least 5% of the population study, among adults (A) and children (B). Overall, 125 food additives were detected in the diet of at least one adult participant, while 122 were identified among children. The mean daily intake of food additive was 113.1 mg/kg of bodyweight per day (SE = 3.2) or 5.1 g/day (SE = 0.2) among children and 56.7 mg/kg of bodyweight per day (SE = 1.3) or 4.4 g/day (SE = 0.1) among adults.
Table 1 Characteristics of participants, Esteban study, France, 2016 a.Fig. 1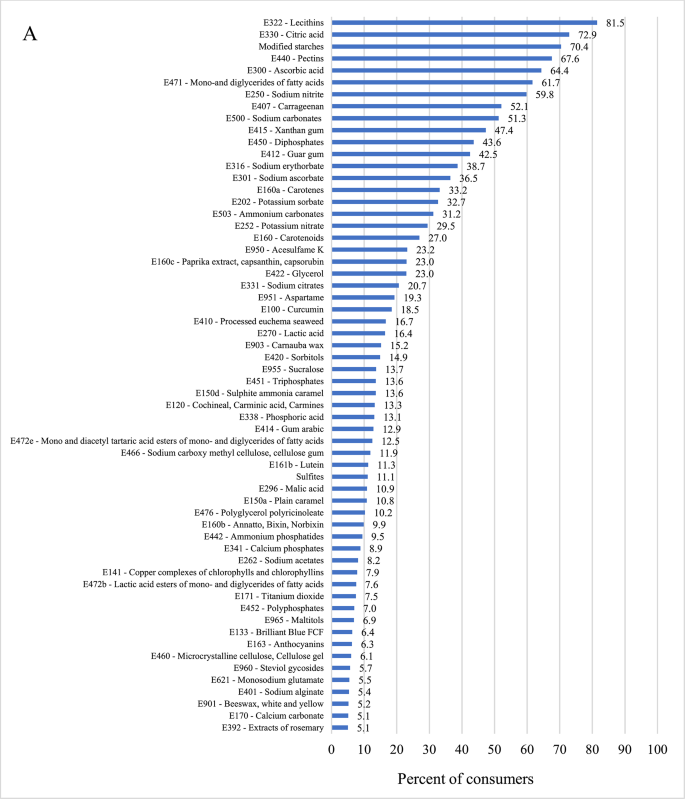
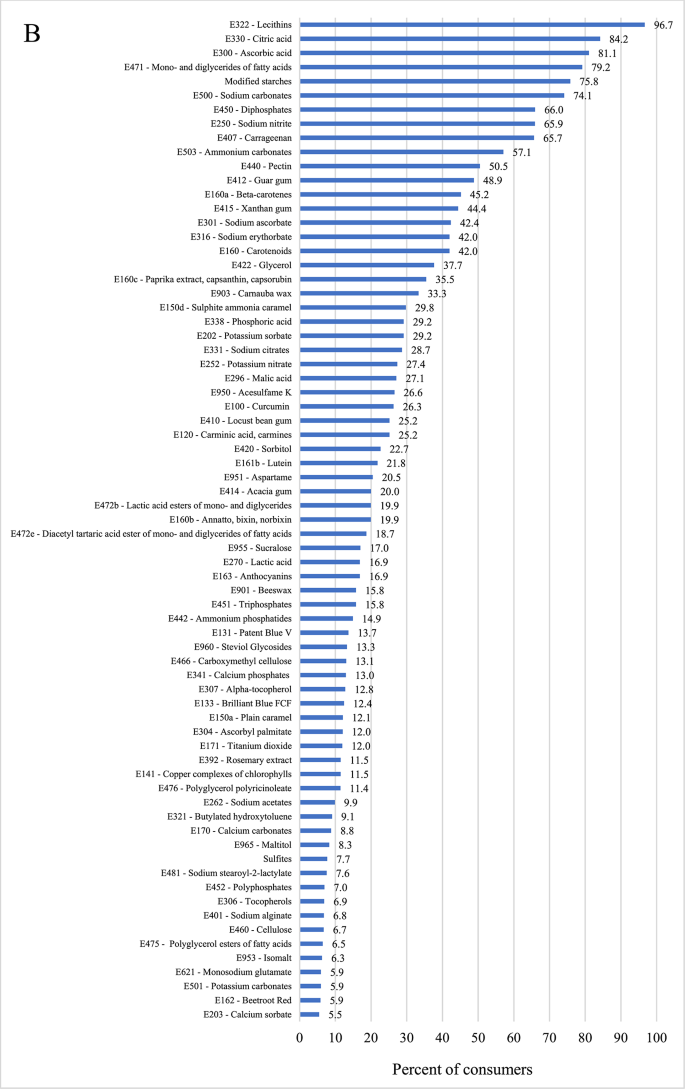
Most frequently consumed food additives by adults ((A), N = 2,177) and children ((B), N = 1,279), Esteban study, France, 2016.
Additionally, 60 food additives were consumed by more than 5% of adults, compared to 71 among children. In this nationally representative study based on three 24 h dietary records/recalls, the percentage of consumers (in adults / children) was for instance: 61.7/79.2% for mono‑ and diglycerides of fatty acids, 52.1/65.7% for carrageenan, 59.8/65.9% for sodium nitrite, 23.2/26.6% for acesulfame K, 19.3/20.5% for aspartame, 13.6/29.8% for sulphite ammonia caramel, 5.5/5.9% for monosodium glutamate, 13.7/17.0% for sucralose, 11.9/13.1% for carboxymethyl cellulose, and 7.5/12.0% for titanium dioxide. Detailed quantitative intakes for each additive are provided in eTable 1 (adults) and eTable 2 (children). Acceptable Daily Intakes (ADI) exceedances were assessed only for food additives consumed by more than 5% of the population. In children, the ADI was exceeded for rosemary extract (E392) in 2.7% of the overall population and in 27.3% among consumers only. Among adults, exceedances were also observed for rosemary extract and sucralose (E955), affecting 0.3% and 0.09% of the total population, and 5.5% and 0.67% of consumers, respectively.
Frequently consumed mixtures of food additives in adults and children
The NMF procedure, conducted on food additives consumed by more than 5% of participants, identified three main food additive mixtures among adults, explaining 76% of the variance and four mixtures in children, explaining 82% of the variance (eTable 3.A.). eTables 5 and 6 respectively show food group consumption and the food groups most correlated with each mixture (Spearman correlation coefficients). eTable 7 compares age and sex-adjusted food additive mixture score across sociodemographic, lifestyle and anthropometric categories. NMF was conducted using the Lee and Sung algorithm, which appeared as the better compromise between good stability with a high cophenetic coefficient and satisfying data representation (low residual sum of squares, eTable 3 in S1 Appendix). However, similar results were obtained with Brunet and nsNMF algorithms (sensitivity analyses in eTables 4.B. and 4.C.). Figure 2 presents a summary of the food additives emblematic of each main mixture in adults (Fig. 2A) and children (Fig. 2B) along with their food groups, socio-demographic, lifestyle and anthropometric correlates.
Fig. 2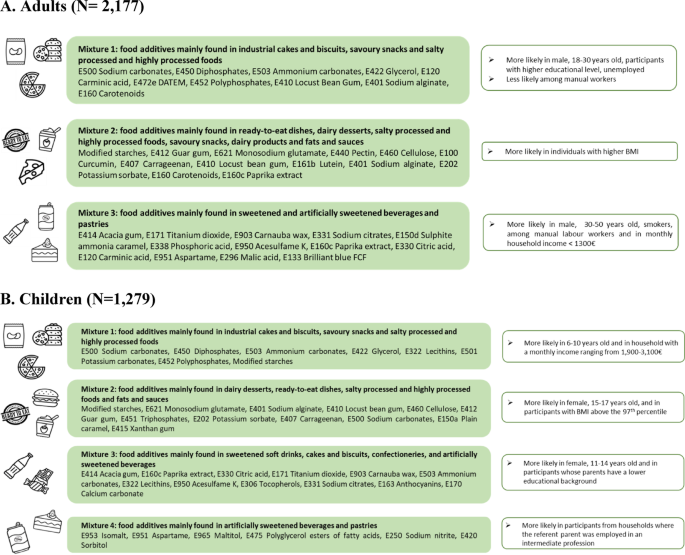
Synthesis of food additive mixtures and their correlated food groups, Esteban study, France, 2016.
Food additive mixtures in adults and their socio-demographic and lifestyle correlatesMixture 1
The primary mixture identified among adults was characterized by acidity regulators (sodium carbonates, ammonium carbonates), emulsifiers and thickeners (diphosphates, glycerol, diacetyl tartaric acid esters of mono- and diglycerides of fatty acids, polyphosphates, locust bean gum, sodium alginate), and food colours (carminic acid, carotenoids). These food additives were commonly found in industrial cakes and biscuits, savoury snacks (salted peanuts or dried fruits), salty processed and highly processed foods (e.g. pizzas, hamburgers, savoury pies) and sweetened soft drinks. Regarding socio-demographic correlates, participants most exposed to this mixture were more likely to be male, younger, have a higher educational level (⩾2 years after high school), and were less likely to be manual workers.
Mixture 2
This mixture was characterized by emulsifiers (modified starches, guar gum, pectin, cellulose, carrageenan, locust bean gum, sodium alginate), several food colours (curcumin, lutein, carotenoids, paprika extract), a preservative (potassium sorbate) and a flavour enhancer (monosodium glutamate). Foods most representative of this mixture were ready-to-eat dishes, dairy desserts, salty processed and highly processed foods, savoury snacks, dairy products and fats and sauce. Higher exposure to mixture 2 was observed among participants with higher BMI.
Mixture 3
The additives that contributed most to this mixture were emulsifiers (acacia gum), acidity regulators (sodium citrates, phosphoric acid, citric acid, malic acid), two food additives sweeteners (acesulfame-K, aspartame), a glazing agent (carnauba wax), and several food colours (titanium dioxide, sulphite ammonia caramel, paprika extract, carminic acid, and brilliant blue FCF). Food groups emblematic of this mixture were both sweetened and artificially sweetened beverages—evidenced by the simultaneous presence of food additives sweeteners, caramel food colour, and several acidity regulators—as well as pastries. Socio-demographic and lifestyle correlates of participants most exposed to mixture 3 included being 30–50 years old, male, smokers, and employed in manual labour.
Food additive mixtures in children and their socio-demographic correlatesMixture 1
This mixture closely resembled the one found in adults and contained acidity regulators (sodium carbonates, ammonium carbonates, potassium carbonates), emulsifiers and thickeners (diphosphates, glycerol, polyphosphates, modified starches), and a texture agent (lecithin). Foods most representative of this mixture were cakes and biscuits, savoury snacks and salty processed and highly processed foods. Children most exposed to this mixture were more likely to be between 6 and 10 years old and to come from households with a monthly income ranging from 1,900 to 3,100 euros.
Mixture 2
This mixture primarily consisted of emulsifiers (modified starches, sodium alginate, locust bean gum, cellulose, guar gum, triphosphates, carrageenan, xanthan gum), along with a flavour enhancer (monosodium glutamate), a preservative (potassium sorbate), an acidity regulator (sodium carbonates), and a food colour (plain caramel). These additives are commonly found in dairy desserts, ready-to-eat dishes, salty processed and highly processed foods and fats and sauces. Female aged 15 to 17 years who had never smoked and were more likely to have a BMI above the 97th percentile according to the IOTF BMI cut-offs were more exposed to this mixture. Additionally, sociodemographic correlates showed that children from households where the referent parent had an intermediate educational level and was employed as managerial staff or as an employee were more likely to be exposed.
Mixture 3
The third mixture was characterized by the presence of an emulsifier (acacia gum), food colours (paprika extract, titanium dioxide, anthocyanin, calcium carbonate), antioxidants (citric acid, lecithin, tocopherols, sodium citrate), a glazing agent (carnauba wax), an acidity regulator (ammonium carbonate), and a food additive sweetener (acesulfame K). Foods most representative of this mixture were sweetened soft drinks, cakes and biscuits, confectioneries, and artificially sweetened beverages. This mixture was predominantly consumed by female children aged 11 to 14 years, who were more likely to have never smoked and to come from a lower educational background.
Mixture 4
The last mixture primarily consisted of intense (aspartame) and bulk (isomalt, maltitol, sorbitol) sweeteners, and an emulsifier (polyglycerol esters of fatty acids) —food additives commonly found in artificially sweetened beverages and pastries. Notably, children from households where the referent parent was employed in an intermediate profession were more likely to be exposed to mixture 4.
Partial Spearman correlations between nutrient intakes and exposure to each food additive mixture adjusted for sex, age and energy intakes (except for energy intake correlations) are presented in eTable 8. Overall, these mixtures were generally inversely associated with intakes of dietary fibre (Adults: Mixture 1: ρ=-0.096, 95% Confidence Interval =[-0.138;-0.053], p < 0.001; Mixture 2: not associated; Mixture 3: -0.097 [-0.133;-0.059], p < 0.001; Children: Mixture 1: not associated; Mixture 2: -0.063 [-0.119;-0.009], p = 0.025; Mixture 3: -0.081 [-0.136;-0.029], p = 0.004 ; Mixture 4: -0.070 [-0.122;-0.018], p = 0.013), protein (Adults: Mixture 1: -0.154 [-0.194;-0.113], p < 0.001; Mixture 2: not associated; Mixture 3: -0.055 [-0.095;-0.016], p = 0.010; Children: Mixture 1: -0.155 [-0.206;-0.098], p < 0.001; Mixture 2: not associated; Mixture 3: -0.089 [-0.146;-0.035], p = 0.001; Mixture 4: not associated), beta-carotene (Adults: Mixture 1: -0.061 [-0.104;-0.019], p = 0.004; Mixture 2: not associated; Mixture 3: -0.078 [-0.117;-0.035], p < 0.001; Children: Mixture 1, 2, 3: not associated; Mixture 4: -0.056 [-0.101;-0.007], p = 0.044), and vitamin C (Adults: Mixture 1: -0.065 [-0.107;-0.021], p = 0.002; Mixture 2: -0.055 [-0.098;-0.015], p = 0.010; Mixture 3: not associated; Children: Mixture 1: not associated; Mixture 2: -0.060 [-0.116;-0.001], p = 0.032; Mixture 3, 4: not associated).
In contrast, positive associations were generally observed with energy intake (Adults: Mixture 1: 0.196 [0.153;0.235], p < 0.001; Mixture 2: 0.144 [0.101;0.186], p < 0.001; Mixture 3: 0.067 [0.026;0.102], p = 0.002; Children: Mixture 1: 0.250, [0.192;0.297], p < 0.001; Mixture 2: 0.164 [0.108;0.224], p < 0.001; Mixture 3: 0.171 [0.108;0.225], p < 0.001 ; Mixture 4: 0.093 [0.029;0.150], p < 0.001), saturated fats (Adults: Mixture 1: 0.069 [0.026;0.113], p < 0.001; Mixture 2: 0.058 [0.015;0.099], p = 0.006; Mixture 3: -0.043 [-0.083;-0.004], 0.044; Children: Mixture 1: not associated; Mixture 2: 0.104 [0.044;0.158], p < 0.001; Mixture 3: -0.086 [-0.140;-0.024], p = 0.002; Mixture 4: not associated), and added sugars (Adults: Mixture 1: 0.189 [0.147;0.231], p < 0.001; Mixture 2: 0.043 [-0.001;0.087], p = 0.045; Mixture 3: ρ = 0.234 [0.176;0.288], p < 0.001; Children: Mixture 1: 0.121 [0.065;0.179], p < 0.001; Mixture 2: 0.057 [0.002;0.112], p = 0.041; Mixture 3: 0.242 [0.195;0.291], p < 0.001; Mixture 4: 0.078 [0.028;0.139], p = 0.005). Exceptions to these trends were observed for nutrients found in specific food groups strongly associated with particular food additive mixtures, e.g. higher calcium intakes were positively correlated with mixture 2 in adults (ρ = 0.056 [0.014;0.098], p = 0.009) and children (ρ = 0.066 [0.009;0.119], p = 0.019), a mixture that was itself associated with dairy desserts.
Dining and Cooking