

Feb 24, 2026
IndexBox has just published a new report: United Kingdom – Olive Oil (Virgin) – Market Analysis, Forecast, Size, Trends and Insights.
The UK virgin olive oil market is forecast for steady growth, with consumption volume expected to reach 42K tons by 2035 at a CAGR of +0.5%, while market value is projected to hit $419M at a stronger CAGR of +2.0%. In 2024, consumption was 40K tons, valued at $339M, driven by a 36% surge in market value. The UK is heavily import-dependent, sourcing 41K tons primarily from Spain (60%), Italy, and Greece, with import prices jumping 35% to $9,634/ton. Exports are minimal at 1K tons, mainly to Ireland, but export prices rose sharply by 68%. The market shows a trend of increasing value driven by higher prices, despite relatively flat volume growth.
Key Findings
UK virgin olive oil market value is forecast to grow faster (+2.0% CAGR) than volume (+0.5% CAGR), reaching $419M by 2035Market value surged 36% in 2024 to $339M, indicating strong price-driven expansion despite modest volume growthSpain dominates UK imports, supplying 60% of the 41K tons imported in 2024, followed by Italy and GreeceAverage import price soared 35% in 2024 to $9,634 per ton, with Italian oil being the most expensiveUK exports are small and declining in volume but saw export value jump 78% since 2021 due to a 68% price increaseMarket Forecast
Driven by increasing demand for virgin olive oil in the UK, the market is expected to continue an upward consumption trend over the next decade. Market performance is forecast to retain its current trend pattern, expanding with an anticipated CAGR of +0.5% for the period from 2024 to 2035, which is projected to bring the market volume to 42K tons by the end of 2035.
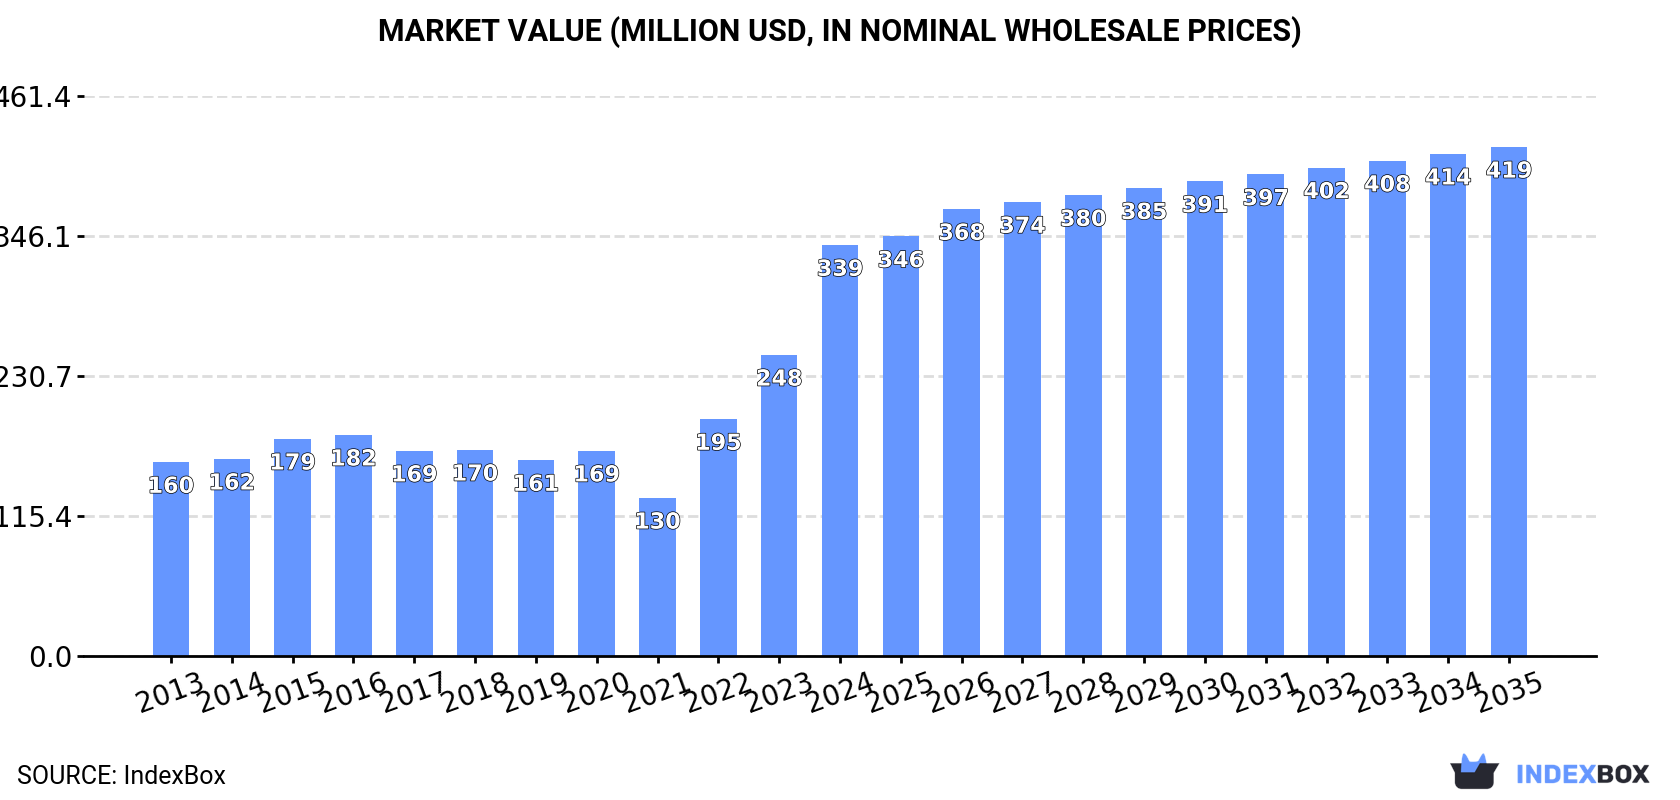
In value terms, the market is forecast to increase with an anticipated CAGR of +2.0% for the period from 2024 to 2035, which is projected to bring the market value to $419M (in nominal wholesale prices) by the end of 2035.
 ConsumptionUnited Kingdom’s Consumption of Virgin Olive Oil
Virgin olive oil consumption in the UK reached 40K tons in 2024, rising by 5.3% compared with 2023. Overall, consumption recorded a relatively flat trend pattern. Virgin olive oil consumption peaked at 49K tons in 2020; however, from 2021 to 2024, consumption stood at a somewhat lower figure.
The size of the virgin olive oil market in the UK surged to $339M in 2024, jumping by 36% against the previous year. This figure reflects the total revenues of producers and importers (excluding logistics costs, retail marketing costs, and retailers’ margins, which will be included in the final consumer price). Over the period under review, consumption posted a prominent expansion. Over the period under review, the market hit record highs in 2024 and is likely to see gradual growth in the near future.
ImportsUnited Kingdom’s Imports of Virgin Olive Oil
In 2024, imports of virgin olive oil into the UK rose slightly to 41K tons, picking up by 4.8% against 2023 figures. Over the period under review, imports recorded a relatively flat trend pattern. The pace of growth appeared the most rapid in 2022 with an increase of 25%. Over the period under review, imports hit record highs at 50K tons in 2020; however, from 2021 to 2024, imports stood at a somewhat lower figure.
In value terms, virgin olive oil imports soared to $396M in 2024. In general, imports continue to indicate a buoyant increase. The pace of growth was the most pronounced in 2022 when imports increased by 56%. Imports peaked in 2024 and are likely to continue growth in years to come.
Imports By Country
In 2024, Spain (25K tons) constituted the largest virgin olive oil supplier to the UK, with a 60% share of total imports. Moreover, virgin olive oil imports from Spain exceeded the figures recorded by the second-largest supplier, Italy (11K tons), twofold. Greece (4.5K tons) ranked third in terms of total imports with an 11% share.
From 2013 to 2024, the average annual growth rate of volume from Spain was relatively modest. The remaining supplying countries recorded the following average annual rates of imports growth: Italy (-1.7% per year) and Greece (+13.7% per year).
In value terms, the largest virgin olive oil suppliers to the UK were Spain ($233M), Italy ($120M) and Greece ($32M), together accounting for 97% of total imports.
In terms of the main suppliers, Greece, with a CAGR of +17.6%, saw the highest rates of growth with regard to the value of imports, over the period under review, while purchases for the other leaders experienced more modest paces of growth.
Import Prices By Country
In 2024, the average virgin olive oil import price amounted to $9,634 per ton, jumping by 35% against the previous year. Over the period under review, the import price saw a buoyant expansion. The most prominent rate of growth was recorded in 2023 an increase of 36% against the previous year. Over the period under review, average import prices attained the peak figure in 2024 and is expected to retain growth in years to come.
There were significant differences in the average prices amongst the major supplying countries. In 2024, amid the top importers, the country with the highest price was Italy ($11,440 per ton), while the price for Greece ($7,153 per ton) was amongst the lowest.
From 2013 to 2024, the most notable rate of growth in terms of prices was attained by Germany (+10.2%), while the prices for the other major suppliers experienced more modest paces of growth.
ExportsUnited Kingdom’s Exports of Virgin Olive Oil
In 2024, approx. 1K tons of virgin olive oil were exported from the UK; waning by -12.1% compared with the previous year’s figure. Overall, exports showed a noticeable decrease. The pace of growth was the most pronounced in 2014 when exports increased by 10% against the previous year. As a result, the exports reached the peak of 1.5K tons. From 2015 to 2024, the growth of the exports failed to regain momentum.
In value terms, virgin olive oil exports soared to $9.6M in 2024. In general, total exports indicated a temperate expansion from 2013 to 2024: its value increased at an average annual rate of +4.2% over the last eleven-year period. The trend pattern, however, indicated some noticeable fluctuations being recorded throughout the analyzed period. Based on 2024 figures, exports increased by +78.0% against 2021 indices. As a result, the exports attained the peak and are likely to continue growth in the immediate term.
Exports By Country
Ireland (697 tons) was the main destination for virgin olive oil exports from the UK, with a 67% share of total exports. Moreover, virgin olive oil exports to Ireland exceeded the volume sent to the second major destination, Italy (74 tons), ninefold. The third position in this ranking was taken by the Netherlands (32 tons), with a 3.1% share.
From 2013 to 2024, the average annual growth rate of volume to Ireland was relatively modest. Exports to the other major destinations recorded the following average annual rates of exports growth: Italy (+55.4% per year) and the Netherlands (+11.0% per year).
In value terms, Ireland ($6.1M) remains the key foreign market for virgin olive oil exports from the UK, comprising 63% of total exports. The second position in the ranking was held by Italy ($585K), with a 6.1% share of total exports. It was followed by Iceland, with a 3.4% share.
From 2013 to 2024, the average annual rate of growth in terms of value to Ireland amounted to +6.7%. Exports to the other major destinations recorded the following average annual rates of exports growth: Italy (+57.1% per year) and Iceland (+60.7% per year).
Export Prices By Country
In 2024, the average virgin olive oil export price amounted to $9,254 per ton, rising by 68% against the previous year. Over the period under review, export price indicated a strong increase from 2013 to 2024: its price increased at an average annual rate of +6.8% over the last eleven-year period. The trend pattern, however, indicated some noticeable fluctuations being recorded throughout the analyzed period. Based on 2024 figures, virgin olive oil export price increased by +110.0% against 2021 indices. As a result, the export price attained the peak level and is likely to continue growth in the immediate term.
There were significant differences in the average prices for the major foreign markets. In 2024, amid the top suppliers, the country with the highest price was the Czech Republic ($14,382 per ton), while the average price for exports to the Netherlands ($3,418 per ton) was amongst the lowest.
From 2013 to 2024, the most notable rate of growth in terms of prices was recorded for supplies to Poland (+9.2%), while the prices for the other major destinations experienced more modest paces of growth.
Source: IndexBox Market Intelligence Platform
This report provides a comprehensive view of the virgin olive oil industry in the United Kingdom, tracking demand, supply, and trade flows across the national value chain. It explains how demand across key channels and end-use segments shapes consumption patterns, while also mapping the role of input availability, production efficiency, and regulatory standards on supply.
Beyond headline metrics, the study benchmarks prices, margins, and trade routes so you can see where value is created and how it moves between domestic suppliers and international partners. The analysis is designed to support strategic planning, market entry, portfolio prioritization, and risk management in the virgin olive oil landscape in the United Kingdom.
Quick navigation
Key findings
Domestic demand is shaped by both household and industrial usage, with trade flows linking local supply to imports and exports.
Pricing dynamics reflect unit values, freight costs, exchange rates, and regulatory shifts that affect sourcing decisions.
Supply depends on input availability and production efficiency, creating a distinct national cost curve.
Market concentration varies by segment, creating different competitive landscapes and entry barriers.
The 2035 outlook highlights where capacity investment and demand growth are most aligned within the country.
Report scope
The report combines market sizing with trade intelligence and price analytics for the United Kingdom. It covers both historical performance and the forward outlook to 2035, allowing you to compare cycles, structural shifts, and policy impacts.
Market size and growth in value and volume terms
Consumption structure by end-use segments
Production capacity, output, and cost dynamics
Trade flows, exporters, importers, and balances
Price benchmarks, unit values, and margin signals
Competitive context and market entry conditions
Product coverageFCL 261 – Oil of Olives, VirginCountry coverageCountry profile and benchmarks
This report provides a consistent view of market size, trade balance, prices, and per-capita indicators for the United Kingdom. The profile highlights demand structure and trade position, enabling benchmarking against regional and global peers.
Methodology
The analysis is built on a multi-source framework that combines official statistics, trade records, company disclosures, and expert validation. Data are standardized, reconciled, and cross-checked to ensure consistency across time series.
International trade data (exports, imports, and mirror statistics)
National production and consumption statistics
Company-level information from financial filings and public releases
Price series and unit value benchmarks
Analyst review, outlier checks, and time-series validation
All data are normalized to a common product definition and mapped to a consistent set of codes. This ensures that comparisons across time are aligned and actionable.
Forecasts to 2035
The forecast horizon extends to 2035 and is based on a structured model that links virgin olive oil demand and supply to macroeconomic indicators, trade patterns, and sector-specific drivers. The model captures both cyclical and structural factors and reflects known policy and technology shifts in the United Kingdom.
Historical baseline: 2012-2025
Forecast horizon: 2026-2035
Scenario-based sensitivity to income growth, substitution, and regulation
Capacity and investment outlook for major producing companies
Each projection is built from national historical patterns and the broader regional context, allowing the report to show where growth is concentrated and where risks are elevated.
Price analysis and trade dynamics
Prices are analyzed in detail, including export and import unit values, regional spreads, and changes in trade costs. The report highlights how seasonality, freight rates, exchange rates, and supply disruptions influence pricing and margins.
Price benchmarks by country and sub-region
Export and import unit value trends
Seasonality and calendar effects in trade flows
Price outlook to 2035 under baseline assumptions
Profiles of market participants
Key producers, exporters, and distributors are profiled with a focus on their operational scale, geographic footprint, product mix, and market positioning. This helps identify competitive pressure points, partnership opportunities, and routes to differentiation.
Business focus and production capabilities
Geographic reach and distribution networks
Cost structure and pricing strategy indicators
Compliance, certification, and sustainability context
How to use this report
Quantify domestic demand and identify the most attractive segments
Evaluate export opportunities and prioritize target destinations
Track price dynamics and protect margins
Benchmark performance against leading competitors
Build evidence-based forecasts for investment decisions
This report is designed for manufacturers, distributors, importers, wholesalers, investors, and advisors who need a clear, data-driven picture of virgin olive oil dynamics in the United Kingdom.
FAQ
What is included in the virgin olive oil market in the United Kingdom?
The market size aggregates consumption and trade data, presented in both value and volume terms.
How are the forecasts to 2035 built?
The projections combine historical trends with macroeconomic indicators, trade dynamics, and sector-specific drivers.
Does the report cover prices and margins?
Yes, it includes export and import unit values, regional spreads, and a pricing outlook to 2035.
Which benchmarks are included?
The report benchmarks market size, trade balance, prices, and per-capita indicators for the United Kingdom.
Can this report support market entry decisions?
Yes, it highlights demand hotspots, trade routes, pricing trends, and competitive context.
1. INTRODUCTION
Making Data-Driven Decisions to Grow Your Business
REPORT DESCRIPTION
RESEARCH METHODOLOGY AND THE AI PLATFORM
DATA-DRIVEN DECISIONS FOR YOUR BUSINESS
GLOSSARY AND SPECIFIC TERMS
2. EXECUTIVE SUMMARY
A Quick Overview of Market Performance
KEY FINDINGS
MARKET TRENDSThis Chapter is Available Only for the Professional EditionPRO
3. MARKET OVERVIEW
Understanding the Current State of The Market and its Prospects
MARKET SIZE: HISTORICAL DATA (2012–2025) AND FORECAST (2026–2035)
MARKET STRUCTURE: HISTORICAL DATA (2012–2025) AND FORECAST (2026–2035)
TRADE BALANCE: HISTORICAL DATA (2012–2025) AND FORECAST (2026–2035)
PER CAPITA CONSUMPTION: HISTORICAL DATA (2012–2025) AND FORECAST (2026–2035)
MARKET FORECAST TO 2035
4. MOST PROMISING PRODUCTS FOR DIVERSIFICATION
Finding New Products to Diversify Your Business
TOP PRODUCTS TO DIVERSIFY YOUR BUSINESS
BEST-SELLING PRODUCTS
MOST CONSUMED PRODUCTS
MOST TRADED PRODUCTS
MOST PROFITABLE PRODUCTS FOR EXPORTS
5. MOST PROMISING SUPPLYING COUNTRIES
Choosing the Best Countries to Establish Your Sustainable Supply Chain
TOP COUNTRIES TO SOURCE YOUR PRODUCT
TOP PRODUCING COUNTRIES
TOP EXPORTING COUNTRIES
LOW-COST EXPORTING COUNTRIES
6. MOST PROMISING OVERSEAS MARKETS
Choosing the Best Countries to Boost Your Export
TOP OVERSEAS MARKETS FOR EXPORTING YOUR PRODUCT
TOP CONSUMING MARKETS
UNSATURATED MARKETS
TOP IMPORTING MARKETS
MOST PROFITABLE MARKETS
7. PRODUCTION
The Latest Trends and Insights into The Industry
PRODUCTION VOLUME AND VALUE: HISTORICAL DATA (2012–2025) AND FORECAST (2026–2035)
8. IMPORTS
The Largest Import Supplying Countries
IMPORTS: HISTORICAL DATA (2012–2025) AND FORECAST (2026–2035)
IMPORTS BY COUNTRY: HISTORICAL DATA (2012–2025)
IMPORT PRICES BY COUNTRY: HISTORICAL DATA (2012–2025)
9. EXPORTS
The Largest Destinations for Exports
EXPORTS: HISTORICAL DATA (2012–2025) AND FORECAST (2026–2035)
EXPORTS BY COUNTRY: HISTORICAL DATA (2012–2025)
EXPORT PRICES BY COUNTRY: HISTORICAL DATA (2012–2025)
10. PROFILES OF MAJOR PRODUCERS
The Largest Producers on The Market and Their Profiles
LIST OF TABLES
Key Findings In 2025
Market Volume, In Physical Terms: Historical Data (2012–2025) and Forecast (2026–2035)
Market Value: Historical Data (2012–2025) and Forecast (2026–2035)
Per Capita Consumption: Historical Data (2012–2025) and Forecast (2026–2035)
Imports, In Physical Terms, By Country, 2012–2025
Imports, In Value Terms, By Country, 2012–2025
Import Prices, By Country, 2012–2025
Exports, In Physical Terms, By Country, 2012–2025
Exports, In Value Terms, By Country, 2012–2025
Export Prices, By Country, 2012–2025
LIST OF FIGURES
Market Volume, In Physical Terms: Historical Data (2012–2025) and Forecast (2026–2035)
Market Value: Historical Data (2012–2025) and Forecast (2026–2035)
Market Structure – Domestic Supply vs. Imports, in Physical Terms: Historical Data (2012–2025) and Forecast (2026–2035)
Market Structure – Domestic Supply vs. Imports, in Value Terms: Historical Data (2012–2025) and Forecast (2026–2035)
Trade Balance, In Physical Terms: Historical Data (2012–2025) and Forecast (2026–2035)
Trade Balance, In Value Terms: Historical Data (2012–2025) and Forecast (2026–2035)
Per Capita Consumption: Historical Data (2012–2025) and Forecast (2026–2035)
Market Volume Forecast to 2035
Market Value Forecast to 2035
Market Size and Growth, By Product
Average Per Capita Consumption, By Product
Exports and Growth, By Product
Export Prices and Growth, By Product
Production Volume and Growth
Exports and Growth
Export Prices and Growth
Market Size and Growth
Per Capita Consumption
Imports and Growth
Import Prices
Production, In Physical Terms: Historical Data (2012–2025) and Forecast (2026–2035)
Production, In Value Terms: Historical Data (2012–2025) and Forecast (2026–2035)
Imports, In Physical Terms: Historical Data (2012–2025) and Forecast (2026–2035)
Imports, In Value Terms: Historical Data (2012–2025) and Forecast (2026–2035)
Imports, In Physical Terms, By Country, 2025
Imports, In Physical Terms, By Country, 2012–2025
Imports, In Value Terms, By Country, 2012–2025
Import Prices, By Country, 2012–2025
Exports, In Physical Terms: Historical Data (2012–2025) and Forecast (2026–2035)
Exports, In Value Terms: Historical Data (2012–2025) and Forecast (2026–2035)
Exports, In Physical Terms, By Country, 2025
Exports, In Physical Terms, By Country, 2012–2025
Exports, In Value Terms, By Country, 2012–2025
Export Prices, By Country, 2012–2025
Dining and Cooking