

Feb 27, 2026
IndexBox has just published a new report: Africa – Olive Oil And Its Fractions – Market Analysis, Forecast, Size, Trends And Insights.
This market analysis provides a comprehensive overview of the olive oil and its fractions sector in Africa for 2024, with a forecast to 2035. It details that despite a significant 11.9% consumption decline in 2024 to 499K tons, the long-term trend remains positive, with an expected CAGR of +0.6% in volume and +2.1% in value, reaching 534K tons and $2.9B by 2035. Morocco, Tunisia, and Algeria dominate consumption, while Tunisia is the leading producer and exporter, accounting for 56% of production and 96% of exports. The continent is a net exporter, with exports surging 79% in 2024 to 274K tons, while imports are minimal and declining. The report also covers per capita consumption, import/export prices, and growth rates for key countries.
Key Findings
Africa’s olive oil market is forecast to grow slowly, with volume CAGR of +0.6% and value CAGR of +2.1%, reaching 534K tons and $2.9B by 2035Morocco, Tunisia, and Algeria are the top consumers, together accounting for 86% of the continent’s total consumption volumeTunisia is the dominant producer and exporter, responsible for 56% of Africa’s production and 96% of its exports in 2024The continent is a major net exporter, with exports skyrocketing 79% in 2024, while imports are small and decliningDespite a significant 11.9% market contraction in 2024, long-term consumption has grown at an average annual rate of +4.9% over the past decadeMarket Forecast
Driven by increasing demand for olive oil and its fractions in Africa, the market is expected to continue an upward consumption trend over the next decade. Market performance is forecast to decelerate, expanding with an anticipated CAGR of +0.6% for the period from 2024 to 2035, which is projected to bring the market volume to 534K tons by the end of 2035.
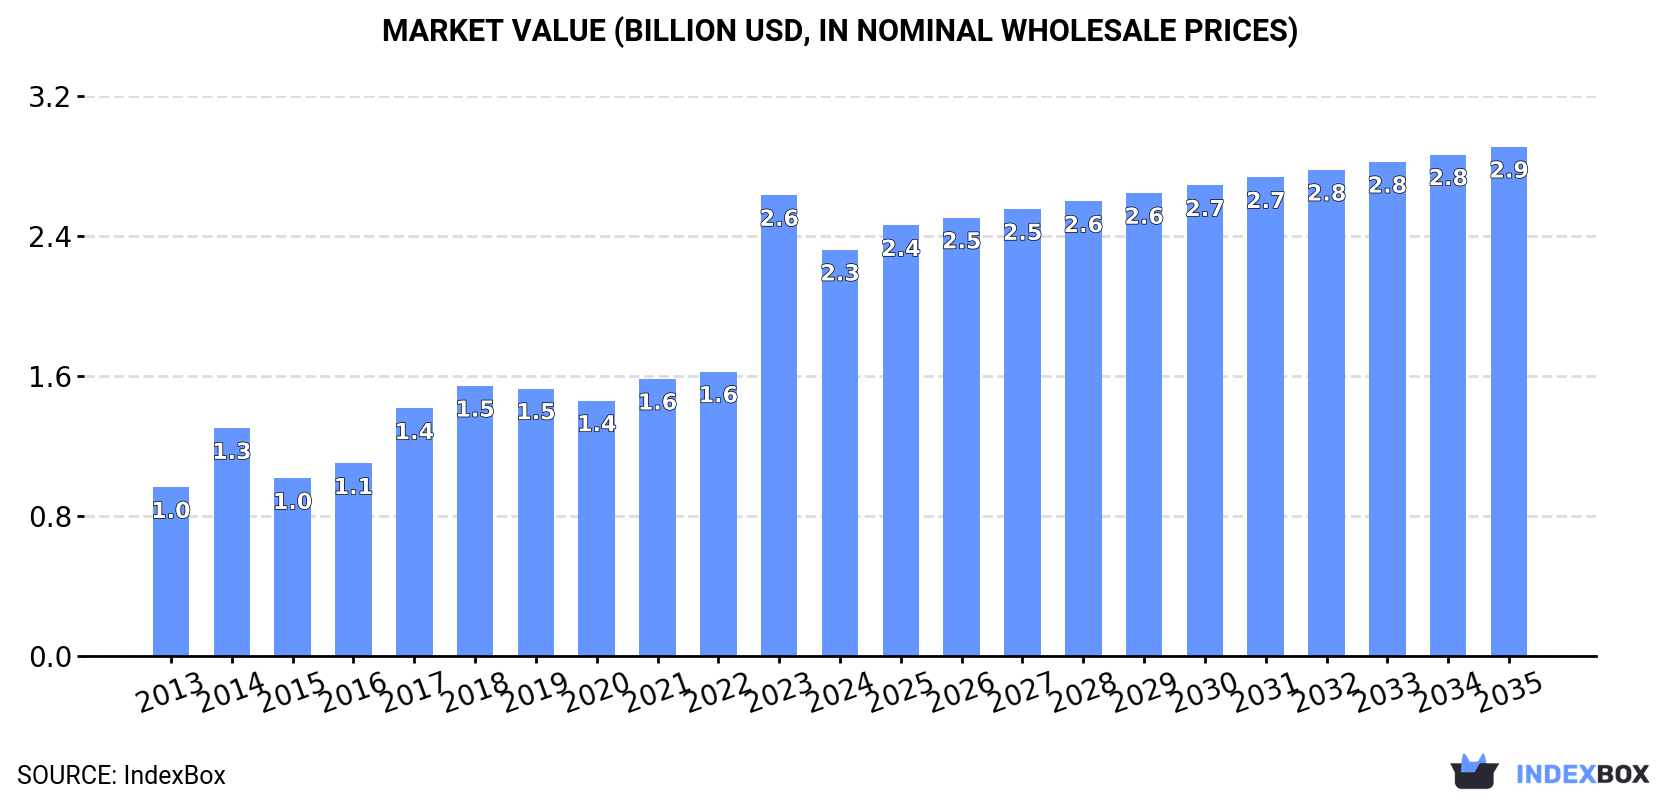
In value terms, the market is forecast to increase with an anticipated CAGR of +2.1% for the period from 2024 to 2035, which is projected to bring the market value to $2.9B (in nominal wholesale prices) by the end of 2035.
 ConsumptionAfrica’s Consumption of Olive Oil And Its Fractions
In 2024, after two years of growth, there was significant decline in consumption of olive oil and its fractions, when its volume decreased by -11.9% to 499K tons. The total consumption indicated noticeable growth from 2013 to 2024: its volume increased at an average annual rate of +4.9% over the last eleven-year period. The trend pattern, however, indicated some noticeable fluctuations being recorded throughout the analyzed period. Based on 2024 figures, consumption increased by +17.1% against 2021 indices. As a result, consumption reached the peak volume of 566K tons, and then contracted in the following year.
The revenue of the olive oil market in Africa dropped to $2.3B in 2024, reducing by -11.9% against the previous year. This figure reflects the total revenues of producers and importers (excluding logistics costs, retail marketing costs, and retailers’ margins, which will be included in the final consumer price). Over the period under review, consumption, however, posted a strong increase. As a result, consumption attained the peak level of $2.6B, and then declined in the following year.
Consumption By Country
The countries with the highest volumes of consumption in 2024 were Morocco (180K tons), Tunisia (165K tons) and Algeria (84K tons), together comprising 86% of total consumption. Egypt and Libya lagged somewhat behind, together accounting for a further 12%.
From 2013 to 2024, the biggest increases were recorded for Egypt (with a CAGR of +13.8%), while consumption for the other leaders experienced more modest paces of growth.
In value terms, Morocco ($1B), Tunisia ($663M) and Algeria ($336M) were the countries with the highest levels of market value in 2024, with a combined 88% share of the total market.
Among the main consuming countries, Tunisia, with a CAGR of +14.3%, recorded the highest rates of growth with regard to market size over the period under review, while market for the other leaders experienced more modest paces of growth.
In 2024, the highest levels of olive oil per capita consumption was registered in Tunisia (13 kg per person), followed by Morocco (4.7 kg per person), Libya (2.5 kg per person) and Algeria (1.8 kg per person), while the world average per capita consumption of olive oil was estimated at 0.3 kg per person.
In Tunisia, olive oil per capita consumption expanded at an average annual rate of +11.5% over the period from 2013-2024. In the other countries, the average annual rates were as follows: Morocco (+2.6% per year) and Libya (-0.3% per year).
ProductionAfrica’s Production of Olive Oil And Its Fractions
In 2024, the amount of olive oil and its fractions produced in Africa rose significantly to 758K tons, growing by 8.1% compared with the previous year. Over the period under review, production showed a resilient expansion. The pace of growth was the most pronounced in 2022 with an increase of 39% against the previous year. As a result, production attained the peak volume of 815K tons. From 2023 to 2024, production growth remained at a somewhat lower figure.
In value terms, olive oil production totaled $3.7B in 2024 estimated in export price. Overall, production showed a buoyant increase. The pace of growth was the most pronounced in 2022 with an increase of 45% against the previous year. Over the period under review, production hit record highs in 2024 and is likely to continue growth in the immediate term.
Production By Country
Tunisia (426K tons) constituted the country with the largest volume of olive oil production, accounting for 56% of total volume. Moreover, olive oil production in Tunisia exceeded the figures recorded by the second-largest producer, Morocco (185K tons), twofold. Algeria (84K tons) ranked third in terms of total production with an 11% share.
In Tunisia, olive oil production expanded at an average annual rate of +7.7% over the period from 2013-2024. The remaining producing countries recorded the following average annual rates of production growth: Morocco (+4.2% per year) and Algeria (+3.3% per year).
ImportsAfrica’s Imports of Olive Oil And Its Fractions
In 2024, purchases abroad of olive oil and its fractions decreased by -17% to 14K tons, falling for the third year in a row after two years of growth. Overall, imports recorded a drastic downturn. The most prominent rate of growth was recorded in 2018 when imports increased by 76%. Over the period under review, imports attained the maximum at 55K tons in 2013; however, from 2014 to 2024, imports stood at a somewhat lower figure.
In value terms, olive oil imports fell to $84M in 2024. Total imports indicated a pronounced expansion from 2013 to 2024: its value increased at an average annual rate of +2.7% over the last eleven-year period. The trend pattern, however, indicated some noticeable fluctuations being recorded throughout the analyzed period. Based on 2024 figures, imports increased by +66.1% against 2019 indices. The pace of growth appeared the most rapid in 2023 when imports increased by 34%. As a result, imports attained the peak of $91M, and then dropped in the following year.
Imports By Country
In 2024, Morocco (3.5K tons), distantly followed by South Africa (1.7K tons), Seychelles (0.9K tons), Cabo Verde (0.9K tons) and Mauritius (0.7K tons) were the main importers of olive oil and its fractions, together generating 53% of total imports. Tunisia (570 tons), Ethiopia (548 tons), Kenya (542 tons), Cote d’Ivoire (438 tons) and Libya (327 tons) held a little share of total imports.
Imports into Morocco decreased at an average annual rate of -3.8% from 2013 to 2024. At the same time, Cabo Verde (+33.1%), Ethiopia (+17.6%), Cote d’Ivoire (+17.6%), Kenya (+3.0%), Tunisia (+2.7%) and Libya (+1.2%) displayed positive paces of growth. Moreover, Cabo Verde emerged as the fastest-growing importer imported in Africa, with a CAGR of +33.1% from 2013-2024. Mauritius experienced a relatively flat trend pattern. By contrast, Seychelles (-2.1%) and South Africa (-4.1%) illustrated a downward trend over the same period. Morocco (+14 p.p.), South Africa (+6.7 p.p.), Cabo Verde (+6.1 p.p.), Seychelles (+4.3 p.p.), Ethiopia (+3.6 p.p.), Mauritius (+3.4 p.p.), Tunisia (+3.2 p.p.), Kenya (+3 p.p.), Cote d’Ivoire (+2.9 p.p.) and Libya (+1.7 p.p.) significantly strengthened its position in terms of the total imports, while the shares of the other countries remained relatively stable throughout the analyzed period.
In value terms, Morocco ($25M) constitutes the largest market for imported olive oil and its fractions in Africa, comprising 30% of total imports. The second position in the ranking was taken by South Africa ($12M), with a 14% share of total imports. It was followed by Mauritius, with a 6.7% share.
In Morocco, olive oil imports expanded at an average annual rate of +3.7% over the period from 2013-2024. In the other countries, the average annual rates were as follows: South Africa (+0.5% per year) and Mauritius (+6.4% per year).
Import Prices By Country
The import price in Africa stood at $5,825 per ton in 2024, increasing by 11% against the previous year. In general, the import price showed a buoyant increase. The most prominent rate of growth was recorded in 2014 an increase of 102%. Over the period under review, import prices hit record highs in 2024 and is expected to retain growth in years to come.
There were significant differences in the average prices amongst the major importing countries. In 2024, amid the top importers, the country with the highest price was Mauritius ($8,441 per ton), while Tunisia ($2,427 per ton) was amongst the lowest.
From 2013 to 2024, the most notable rate of growth in terms of prices was attained by Morocco (+7.7%), while the other leaders experienced more modest paces of growth.
ExportsAfrica’s Exports of Olive Oil And Its Fractions
Olive oil exports skyrocketed to 274K tons in 2024, growing by 79% on the previous year’s figure. In general, exports recorded a strong increase. The most prominent rate of growth was recorded in 2015 when exports increased by 339% against the previous year. Over the period under review, the exports reached the peak figure at 403K tons in 2022; however, from 2023 to 2024, the exports failed to regain momentum.
In value terms, olive oil exports soared to $1.3B in 2024. Overall, exports enjoyed a buoyant expansion. The pace of growth was the most pronounced in 2015 with an increase of 301% against the previous year. The level of export peaked at $1.6B in 2022; however, from 2023 to 2024, the exports remained at a lower figure.
Exports By Country
Tunisia prevails in exports structure, accounting for 262K tons, which was approx. 96% of total exports in 2024. Morocco (8K tons) held a minor share of total exports.
From 2013 to 2024, average annual rates of growth with regard to olive oil exports from Tunisia stood at +5.6%. At the same time, Morocco (+5.8%) displayed positive paces of growth. Moreover, Morocco emerged as the fastest-growing exporter exported in Africa, with a CAGR of +5.8% from 2013-2024. The shares of the largest exporters remained relatively stable throughout the analyzed period.
In value terms, Tunisia ($1.2B) remains the largest olive oil supplier in Africa, comprising 92% of total exports. The second position in the ranking was taken by Morocco ($65M), with a 5% share of total exports.
From 2013 to 2024, the average annual growth rate of value in Tunisia totaled +8.6%.
Export Prices By Country
In 2024, the export price in Africa amounted to $4,697 per ton, reducing by -22.8% against the previous year. Export price indicated a pronounced increase from 2013 to 2024: its price increased at an average annual rate of +3.1% over the last eleven years. The trend pattern, however, indicated some noticeable fluctuations being recorded throughout the analyzed period. Based on 2024 figures, olive oil export price increased by +110.2% against 2020 indices. The pace of growth appeared the most rapid in 2023 an increase of 57% against the previous year. As a result, the export price attained the peak level of $6,083 per ton, and then plummeted in the following year.
There were significant differences in the average prices amongst the major exporting countries. In 2024, amid the top suppliers, the country with the highest price was Morocco ($8,044 per ton), while Tunisia totaled $4,536 per ton.
From 2013 to 2024, the most notable rate of growth in terms of prices was attained by Morocco (+6.9%).
Source: IndexBox Market Intelligence Platform
This report provides a comprehensive view of the olive oil industry in Africa, tracking demand, supply, and trade flows across the regional value chain. It explains how demand across key channels and end-use segments shapes consumption patterns, while also mapping the role of input availability, production efficiency, and regulatory standards on supply.
Beyond headline metrics, the study benchmarks prices, margins, and trade routes so you can see where value is created and how it moves between exporters and importers within Africa. The analysis is designed to support strategic planning, market entry, portfolio prioritization, and risk management in the olive oil landscape in Africa.
Quick navigation
Key findings
Regional demand is shaped by both household and industrial usage, with trade flows linking supply hubs to import-reliant countries.
Pricing dynamics reflect unit values, freight costs, exchange rates, and regulatory shifts that affect sourcing decisions.
Supply depends on input availability and production efficiency, creating distinct cost curves across Africa.
Market concentration varies by country, creating different competitive landscapes and entry barriers.
The 2035 outlook highlights where capacity investment and demand growth are most aligned within the region.
Report scope
The report combines market sizing with trade intelligence and price analytics for Africa. It covers both historical performance and the forward outlook to 2035, allowing you to compare cycles, structural shifts, and policy impacts across countries and sub-regions.
Market size and growth in value and volume terms
Consumption structure by end-use segments and countries
Production capacity, output, and cost dynamics
Regional trade flows, exporters, importers, and balances
Price benchmarks, unit values, and margin signals
Competitive context and market entry conditions
Product coverageFCL 261 – Oil of Olives, VirginCountry coverageCountry profiles and benchmarks
For the regional report, country profiles provide a consistent view of market size, trade balance, prices, and per-capita indicators across Africa. The profiles highlight the largest consuming and producing markets and allow direct benchmarking across peers.
Methodology
The analysis is built on a multi-source framework that combines official statistics, trade records, company disclosures, and expert validation. Data are standardized, reconciled, and cross-checked to ensure consistency across time series.
International trade data (exports, imports, and mirror statistics)
National production and consumption statistics
Company-level information from financial filings and public releases
Price series and unit value benchmarks
Analyst review, outlier checks, and time-series validation
All data are normalized to a common product definition and mapped to a consistent set of codes. This ensures that comparisons across time are aligned and actionable.
Forecasts to 2035
The forecast horizon extends to 2035 and is based on a structured model that links olive oil demand and supply to macroeconomic indicators, trade patterns, and sector-specific drivers. The model captures both cyclical and structural factors and reflects known policy and technology shifts within Africa.
Historical baseline: 2012-2025
Forecast horizon: 2026-2035
Scenario-based sensitivity to income growth, substitution, and regulation
Capacity and investment outlook for major producing countries
Each country projection is built from its own historical pattern and the regional context, allowing the report to show where growth is concentrated and where risks are elevated.
Price analysis and trade dynamics
Prices are analyzed in detail, including export and import unit values, regional spreads, and changes in trade costs. The report highlights how seasonality, freight rates, exchange rates, and supply disruptions influence pricing and margins.
Price benchmarks by country and sub-region
Export and import unit value trends
Seasonality and calendar effects in trade flows
Price outlook to 2035 under baseline assumptions
Profiles of market participants
Key producers, exporters, and distributors are profiled with a focus on their operational scale, geographic footprint, product mix, and market positioning. This helps identify competitive pressure points, partnership opportunities, and routes to differentiation.
Business focus and production capabilities
Geographic reach and distribution networks
Cost structure and pricing strategy indicators
Compliance, certification, and sustainability context
How to use this report
Quantify regional demand and identify the most attractive country markets
Evaluate export opportunities and prioritize target destinations
Track price dynamics and protect margins
Benchmark performance against regional competitors
Build evidence-based forecasts for investment decisions
This report is designed for manufacturers, distributors, importers, wholesalers, investors, and advisors who need a clear, data-driven picture of olive oil dynamics in Africa.
FAQ
What is included in the olive oil market in Africa?
The market size aggregates consumption and trade data at country and sub-regional levels, presented in both value and volume terms.
How are the forecasts to 2035 built?
The projections combine historical trends with macroeconomic indicators, trade dynamics, and sector-specific drivers.
Does the report cover prices and margins?
Yes, it includes export and import unit values, regional spreads, and a pricing outlook to 2035.
Which countries are profiled in detail?
The report provides profiles for the largest consuming and producing countries in Africa.
Can this report support market entry decisions?
Yes, it highlights demand hotspots, trade routes, pricing trends, and competitive context.
Dining and Cooking