

Apr 18, 2025
IndexBox has just published a new report: World – Olive Oil And Its Fractions – Market Analysis, Forecast, Size, Trends And Insights.
The global olive oil market is on the rise, fueled by growing demand worldwide. Projections show a steady increase in consumption with a forecasted CAGR of +0.6% in volume and +2.4% in value from 2024 to 2035. Don’t miss out on the opportunity to stay ahead of the curve in this thriving market.
Market Forecast
Driven by increasing demand for olive oil and its fractions worldwide, the market is expected to continue an upward consumption trend over the next decade. Market performance is forecast to decelerate, expanding with an anticipated CAGR of +0.6% for the period from 2024 to 2035, which is projected to bring the market volume to 4.2M tons by the end of 2035.
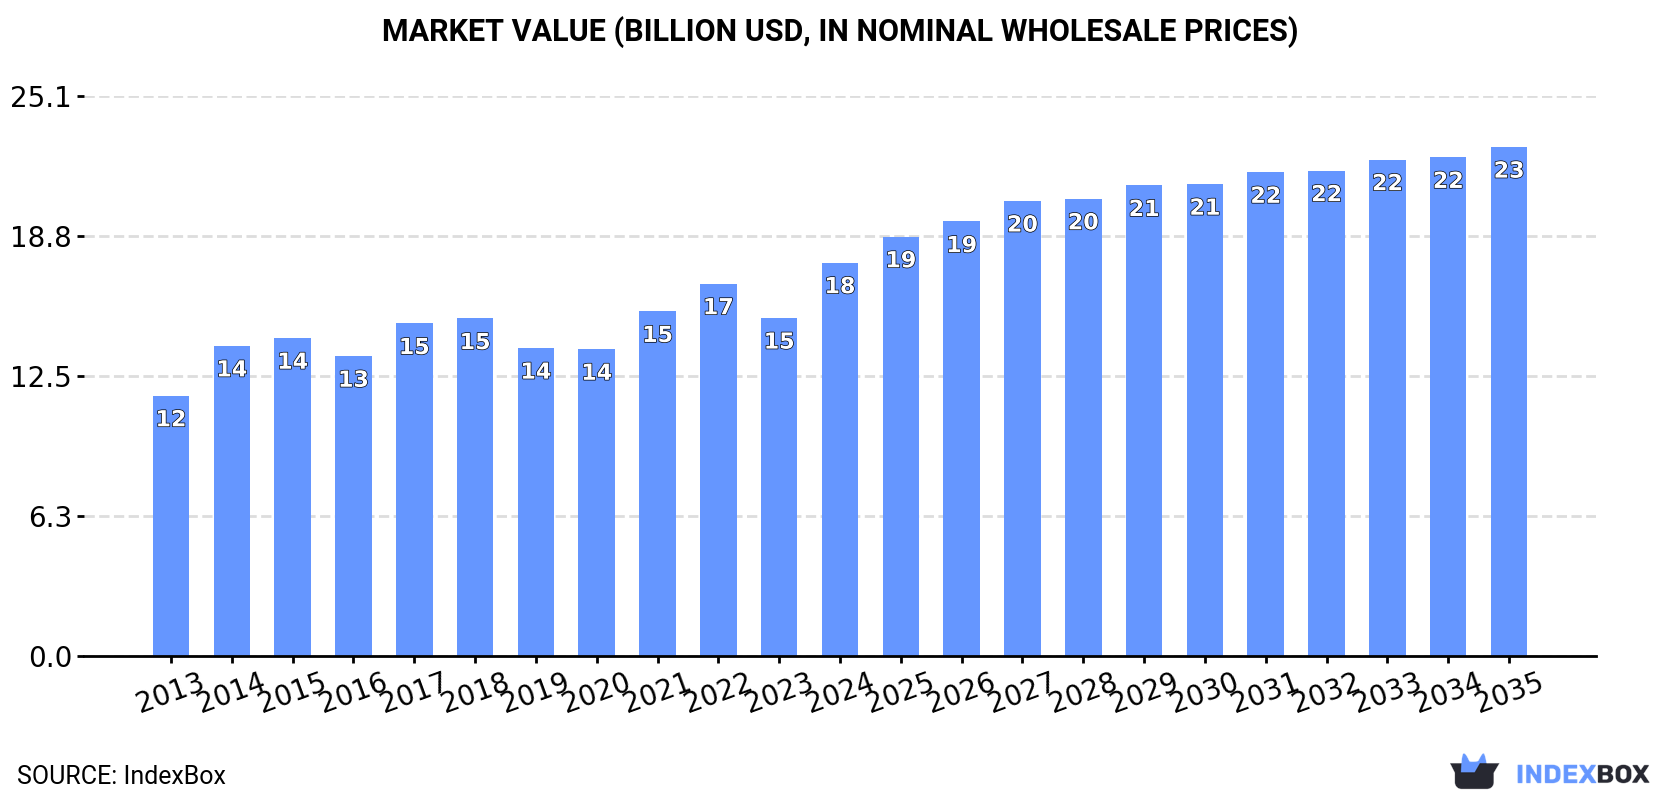
In value terms, the market is forecast to increase with an anticipated CAGR of +2.4% for the period from 2024 to 2035, which is projected to bring the market value to $22.8B (in nominal wholesale prices) by the end of 2035.
 ConsumptionWorld’s Consumption of Olive Oil And Its Fractions
In 2024, the amount of olive oil and its fractions consumed worldwide expanded markedly to 3.9M tons, picking up by 10% compared with 2023 figures. The total consumption volume increased at an average annual rate of +2.5% from 2013 to 2024; the trend pattern remained consistent, with somewhat noticeable fluctuations throughout the analyzed period. Global consumption peaked at 4.1M tons in 2022; however, from 2023 to 2024, consumption failed to regain momentum.
The global olive oil market size surged to $17.6B in 2024, with an increase of 16% against the previous year. This figure reflects the total revenues of producers and importers (excluding logistics costs, retail marketing costs, and retailers’ margins, which will be included in the final consumer price). The market value increased at an average annual rate of +3.8% from 2013 to 2024; the trend pattern indicated some noticeable fluctuations being recorded in certain years. Global consumption peaked in 2024 and is expected to retain growth in the immediate term.
Consumption By Country
Spain (1.6M tons) constituted the country with the largest volume of olive oil consumption, accounting for 40% of total volume. Moreover, olive oil consumption in Spain exceeded the figures recorded by the second-largest consumer, Italy (430K tons), fourfold. The United States (280K tons) ranked third in terms of total consumption with a 7.1% share.
From 2013 to 2024, the average annual growth rate of volume in Spain totaled +5.5%. In the other countries, the average annual rates were as follows: Italy (-3.0% per year) and the United States (+3.4% per year).
In value terms, Spain ($4.7B) led the market, alone. The second position in the ranking was taken by the United States ($2.2B). It was followed by Italy.
In Spain, the olive oil market expanded at an average annual rate of +3.0% over the period from 2013-2024. In the other countries, the average annual rates were as follows: the United States (+9.2% per year) and Italy (-0.1% per year).
In 2024, the highest levels of olive oil per capita consumption was registered in Spain (33 kg per person), followed by Tunisia (7.5 kg per person), Italy (7.3 kg per person) and Morocco (4.7 kg per person), while the world average per capita consumption of olive oil was estimated at 0.5 kg per person.
From 2013 to 2024, the average annual rate of growth in terms of the olive oil per capita consumption in Spain amounted to +5.4%. In the other countries, the average annual rates were as follows: Tunisia (+5.6% per year) and Italy (-2.8% per year).
ProductionWorld’s Production of Olive Oil And Its Fractions
In 2024, approx. 3.7M tons of olive oil and its fractions were produced worldwide; with an increase of 6.5% compared with 2023 figures. The total output volume increased at an average annual rate of +2.2% from 2013 to 2024; the trend pattern remained consistent, with only minor fluctuations throughout the analyzed period. The pace of growth appeared the most rapid in 2014 when the production volume increased by 24% against the previous year. Over the period under review, global production attained the maximum volume at 4M tons in 2020; however, from 2021 to 2024, production stood at a somewhat lower figure.
In value terms, olive oil production expanded rapidly to $15.1B in 2024 estimated in export price. The total output value increased at an average annual rate of +2.7% over the period from 2013 to 2024; the trend pattern remained relatively stable, with somewhat noticeable fluctuations in certain years. The growth pace was the most rapid in 2014 when the production volume increased by 20% against the previous year. Global production peaked at $16.2B in 2022; however, from 2023 to 2024, production failed to regain momentum.
Production By Country
Spain (1.8M tons) constituted the country with the largest volume of olive oil production, accounting for 50% of total volume. Moreover, olive oil production in Spain exceeded the figures recorded by the second-largest producer, Italy (303K tons), sixfold. The third position in this ranking was held by Turkey (282K tons), with a 7.6% share.
In Spain, olive oil production expanded at an average annual rate of +3.2% over the period from 2013-2024. In the other countries, the average annual rates were as follows: Italy (-3.6% per year) and Turkey (+3.8% per year).
ImportsWorld’s Imports of Olive Oil And Its Fractions
Global olive oil imports rose rapidly to 1.6M tons in 2024, growing by 5.1% on the previous year. The total import volume increased at an average annual rate of +1.3% from 2013 to 2024; however, the trend pattern indicated some noticeable fluctuations being recorded throughout the analyzed period. The most prominent rate of growth was recorded in 2020 when imports increased by 18% against the previous year. As a result, imports attained the peak of 2.1M tons. From 2021 to 2024, the growth of global imports remained at a somewhat lower figure.
In value terms, olive oil imports skyrocketed to $13.8B in 2024. In general, imports continue to indicate a buoyant increase. As a result, imports attained the peak and are likely to continue growth in the immediate term.
Imports By Country
Italy (362K tons), the United States (274K tons) and Spain (191K tons) represented roughly 51% of total imports in 2024. France (106K tons) took a 6.5% share (based on physical terms) of total imports, which put it in second place, followed by Portugal (4.6%). Brazil (70K tons), Germany (56K tons), Turkey (51K tons), Canada (42K tons) and the UK (39K tons) followed a long way behind the leaders.
From 2013 to 2024, the biggest increases were recorded for Turkey (with a CAGR of +64.5%), while purchases for the other global leaders experienced more modest paces of growth.
In value terms, Italy ($3.1B), the United States ($2.5B) and Spain ($1.4B) appeared to be the countries with the highest levels of imports in 2024, with a combined 51% share of global imports. France, Brazil, Germany, Portugal, the UK, Canada and Turkey lagged somewhat behind, together comprising a further 28%.
Among the main importing countries, Turkey, with a CAGR of +71.8%, recorded the highest growth rate of the value of imports, over the period under review, while purchases for the other global leaders experienced more modest paces of growth.
Import Prices By Country
The average olive oil import price stood at $8,458 per ton in 2024, jumping by 34% against the previous year. In general, the import price saw a prominent increase. The pace of growth appeared the most rapid in 2023 an increase of 48%. Over the period under review, average import prices attained the peak figure in 2024 and is expected to retain growth in years to come.
Prices varied noticeably by country of destination: amid the top importers, the country with the highest price was Germany ($10,874 per ton), while Turkey ($5,976 per ton) was amongst the lowest.
From 2013 to 2024, the most notable rate of growth in terms of prices was attained by the UK (+9.1%), while the other global leaders experienced more modest paces of growth.
ExportsWorld’s Exports of Olive Oil And Its Fractions
In 2024, shipments abroad of olive oil and its fractions decreased by -4.5% to 1.4M tons, falling for the fourth year in a row after three years of growth. Overall, exports, however, showed a relatively flat trend pattern. The growth pace was the most rapid in 2020 when exports increased by 22% against the previous year. As a result, the exports attained the peak of 2.1M tons. From 2021 to 2024, the growth of the global exports remained at a lower figure.
In value terms, olive oil exports soared to $11.8B in 2024. Over the period under review, total exports indicated a buoyant expansion from 2013 to 2024: its value increased at an average annual rate of +7.3% over the last eleven years. The trend pattern, however, indicated some noticeable fluctuations being recorded throughout the analyzed period. Based on 2024 figures, exports increased by +98.6% against 2019 indices. As a result, the exports reached the peak and are likely to continue growth in the immediate term.
Exports By Country
In 2024, Spain (469K tons) was the key exporter of olive oil and its fractions, achieving 33% of total exports. Italy (236K tons) took a 17% share (based on physical terms) of total exports, which put it in second place, followed by Portugal (13%), Tunisia (11%), Greece (8.5%), Turkey (5.3%) and Syrian Arab Republic (4.8%).
From 2013 to 2024, the most notable rate of growth in terms of shipments, amongst the main exporting countries, was attained by Syrian Arab Republic (with a CAGR of +12.6%), while the other global leaders experienced more modest paces of growth.
In value terms, Spain ($4.2B), Italy ($2.6B) and Portugal ($1.5B) appeared to be the countries with the highest levels of exports in 2024, with a combined 70% share of global exports. Greece, Tunisia, Turkey and Syrian Arab Republic lagged somewhat behind, together comprising a further 23%.
Syrian Arab Republic, with a CAGR of +15.4%, saw the highest rates of growth with regard to the value of exports, in terms of the main exporting countries over the period under review, while shipments for the other global leaders experienced more modest paces of growth.
Export Prices By Country
The average olive oil export price stood at $8,321 per ton in 2024, rising by 29% against the previous year. Over the period under review, the export price posted a prominent increase. The most prominent rate of growth was recorded in 2023 when the average export price increased by 47%. The global export price peaked in 2024 and is expected to retain growth in the near future.
There were significant differences in the average prices amongst the major exporting countries. In 2024, amid the top suppliers, the country with the highest price was Italy ($10,920 per ton), while Syrian Arab Republic ($3,387 per ton) was amongst the lowest.
From 2013 to 2024, the most notable rate of growth in terms of prices was attained by Greece (+8.6%), while the other global leaders experienced more modest paces of growth.
Source: IndexBox Market Intelligence Platform
This report provides an in-depth analysis of the global olive oil market. Within it, you will discover the latest data on market trends and opportunities by country, consumption, production and price developments, as well as the global trade (imports and exports). The forecast exhibits the market prospects through 2030.
Product coverage:FCL 261 – Oil of Olives, VirginCountry coverage:
Worldwide – the report contains statistical data for 200 countries and includes detailed profiles of the 50 largest consuming countries:
+ the largest producing countries
Data coverage:Global market volume and valuePer Capita consumptionForecast of the market dynamics in the medium termGlobal production, split by region and countryGlobal trade (exports and imports)Export and import pricesMarket trends, drivers and restraintsKey market players and their profilesCompany coverage:
Grupo Jaencoop, Borges USA, Inc., Maeva Group, Hojiblanca, Deoleo, S.A., Sovena Group, Gallo, Mueloliva, Minerva, Carbonell, Ybarra, BETIS, Grup Pons, Olivoila, Lamasia, Filippo Berio, Pompeian, Inc., Colavita USA, LLC, California Olive Ranch Inc., Botticelli Foods LLC
Reasons to buy this report:Take advantage of the latest dataFind deeper insights into current market developmentsDiscover vital success factors affecting the market
This report is designed for manufacturers, distributors, importers, and wholesalers, as well as for investors, consultants and advisors.
In this report, you can find information that helps you to make informed decisions on the following issues:
How to diversify your business and benefit from new market opportunitiesHow to load your idle production capacityHow to boost your sales on overseas marketsHow to increase your profit marginsHow to make your supply chain more sustainableHow to reduce your production and supply chain costsHow to outsource production to other countriesHow to prepare your business for global expansion
While doing this research, we combine the accumulated expertise of our analysts and the capabilities of artificial intelligence. The AI-based platform, developed by our data scientists, constitutes the key working tool for business analysts, empowering them to discover deep insights and ideas from the marketing data.