

Apr 17, 2025
IndexBox has just published a new report: EU – Refined Olive Oil – Market Analysis, Forecast, Size, Trends And Insights.
The European Union’s refined olive oil market is set to experience steady growth over the next decade, with consumption levels on the rise. Market performance is forecasted to increase with a CAGR of +0.3% in volume and +1.2% in value from 2024 to 2035.
Market Forecast
Driven by increasing demand for refined olive oil in the European Union, the market is expected to continue an upward consumption trend over the next decade. Market performance is forecast to decelerate, expanding with an anticipated CAGR of +0.3% for the period from 2024 to 2035, which is projected to bring the market volume to 1.3M tons by the end of 2035.
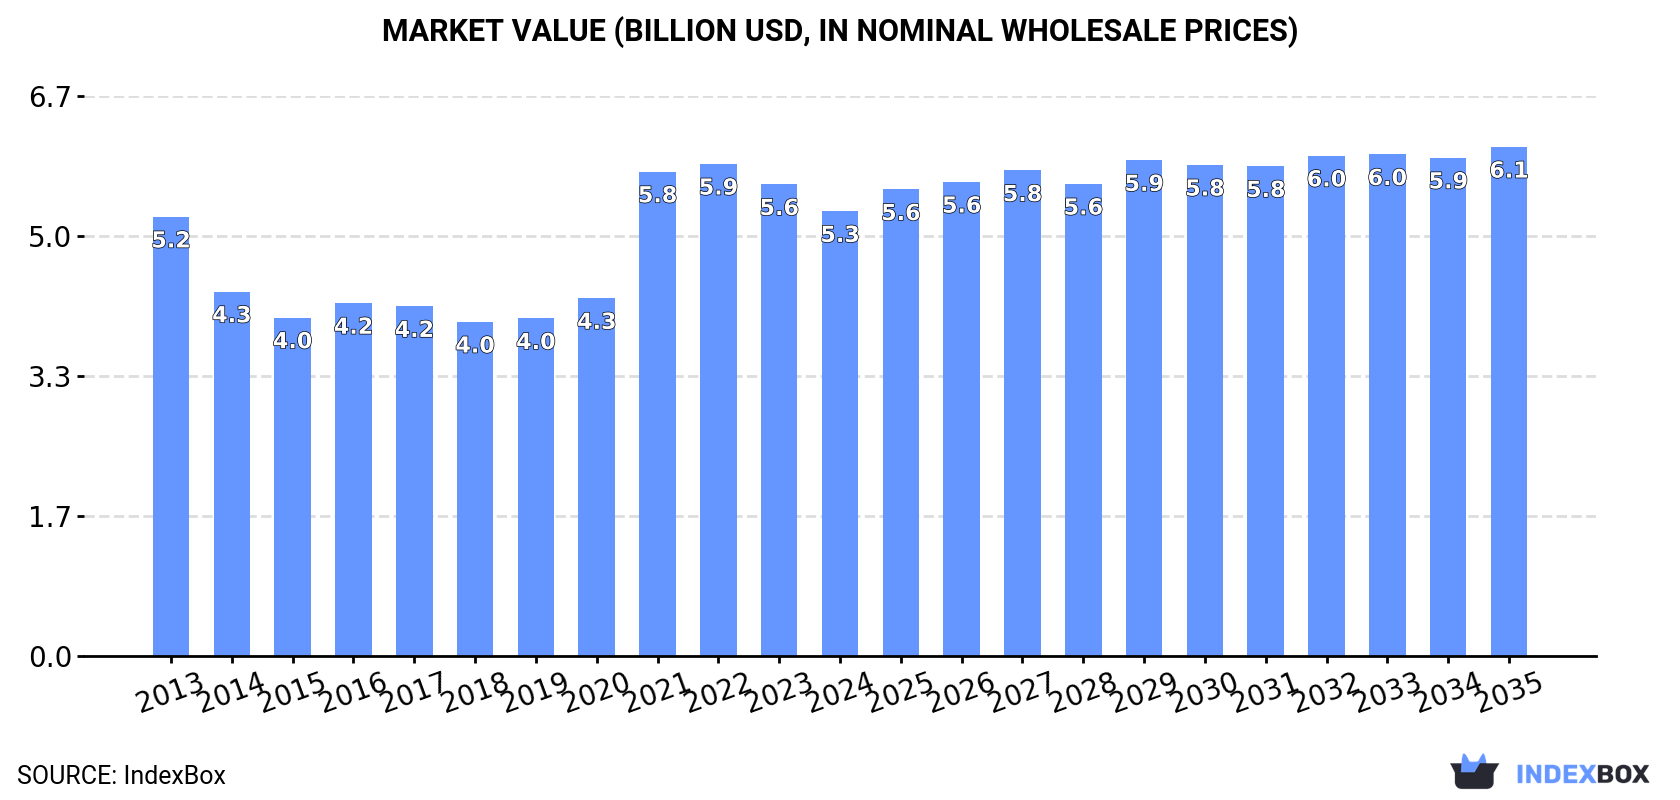
In value terms, the market is forecast to increase with an anticipated CAGR of +1.2% for the period from 2024 to 2035, which is projected to bring the market value to $6.1B (in nominal wholesale prices) by the end of 2035.
 ConsumptionEuropean Union’s Consumption of Refined Olive Oil
In 2024, the amount of refined olive oil consumed in the European Union reached 1.3M tons, almost unchanged from the year before. The total consumption indicated a modest increase from 2013 to 2024: its volume increased at an average annual rate of +1.1% over the last eleven-year period. The trend pattern, however, indicated some noticeable fluctuations being recorded throughout the analyzed period. Based on 2024 figures, consumption increased by +52.4% against 2017 indices. The volume of consumption peaked in 2024 and is expected to retain growth in the immediate term.
The revenue of the refined olive oil market in the European Union declined to $5.3B in 2024, with a decrease of -5.7% against the previous year. This figure reflects the total revenues of producers and importers (excluding logistics costs, retail marketing costs, and retailers’ margins, which will be included in the final consumer price). In general, consumption showed a relatively flat trend pattern. Over the period under review, the market reached the maximum level at $5.9B in 2022; however, from 2023 to 2024, consumption remained at a lower figure.
Consumption By Country
The countries with the highest volumes of consumption in 2024 were Spain (302K tons), Germany (235K tons) and France (175K tons), with a combined 56% share of total consumption. Italy, Poland, Romania, the Czech Republic, the Netherlands, Hungary and Belgium lagged somewhat behind, together comprising a further 29%.
From 2013 to 2024, the biggest increases were recorded for Italy (with a CAGR of +8.7%), while consumption for the other leaders experienced more modest paces of growth.
In value terms, France ($1.4B), Germany ($1.1B) and Italy ($425M) constituted the countries with the highest levels of market value in 2024, with a combined 56% share of the total market.
Among the main consuming countries, Italy, with a CAGR of +11.1%, recorded the highest rates of growth with regard to market size over the period under review, while market for the other leaders experienced more modest paces of growth.
In 2024, the highest levels of refined olive oil per capita consumption was registered in Spain (6.4 kg per person), followed by the Czech Republic (3.1 kg per person), Hungary (3.1 kg per person) and Germany (2.8 kg per person), while the world average per capita consumption of refined olive oil was estimated at 2.8 kg per person.
From 2013 to 2024, the average annual growth rate of the refined olive oil per capita consumption in Spain amounted to +1.6%. In the other countries, the average annual rates were as follows: the Czech Republic (+2.0% per year) and Hungary (+3.5% per year).
ProductionEuropean Union’s Production of Refined Olive Oil
After two years of decline, production of refined olive oil increased by 1.4% to 1.4M tons in 2024. The total output volume increased at an average annual rate of +1.2% from 2013 to 2024; however, the trend pattern indicated some noticeable fluctuations being recorded in certain years. The most prominent rate of growth was recorded in 2020 with an increase of 19%. The volume of production peaked at 1.5M tons in 2021; however, from 2022 to 2024, production remained at a lower figure.
In value terms, refined olive oil production amounted to $6.9B in 2024 estimated in export price. The total production indicated a mild increase from 2013 to 2024: its value increased at an average annual rate of +1.6% over the last eleven years. The trend pattern, however, indicated some noticeable fluctuations being recorded throughout the analyzed period. Based on 2024 figures, production decreased by -1.3% against 2022 indices. The pace of growth appeared the most rapid in 2021 when the production volume increased by 36%. Over the period under review, production reached the maximum level at $6.9B in 2022; afterwards, it flattened through to 2024.
Production By Country
The countries with the highest volumes of production in 2024 were Spain (459K tons), Germany (231K tons) and France (174K tons), together accounting for 60% of total production. Italy, Poland, Romania, Portugal, Greece, the Czech Republic and Hungary lagged somewhat behind, together comprising a further 28%.
From 2013 to 2024, the biggest increases were recorded for Portugal (with a CAGR of +19.7%), while production for the other leaders experienced more modest paces of growth.
ImportsEuropean Union’s Imports of Refined Olive Oil
Refined olive oil imports reduced rapidly to 110K tons in 2024, dropping by -21% on the previous year. Over the period under review, imports continue to indicate a slight curtailment. The pace of growth was the most pronounced in 2022 with an increase of 47% against the previous year. As a result, imports reached the peak of 162K tons. From 2023 to 2024, the growth of imports remained at a lower figure.
In value terms, refined olive oil imports expanded slightly to $820M in 2024. In general, imports, however, showed a remarkable increase. The growth pace was the most rapid in 2022 when imports increased by 70% against the previous year. Over the period under review, imports hit record highs in 2024 and are likely to see gradual growth in the near future.
Imports By Country
Italy (32K tons) and Spain (30K tons) were the major importers of refined olive oil in 2024, accounting for approx. 29% and 27% of total imports, respectively. Portugal (19K tons) ranks next in terms of the total imports with a 17% share, followed by the Netherlands (5%) and Germany (4.8%). France (3.4K tons), Belgium (2.7K tons) and Austria (1.8K tons) took a minor share of total imports.
From 2013 to 2024, the biggest increases were recorded for Spain (with a CAGR of +7.8%), while purchases for the other leaders experienced more modest paces of growth.
In value terms, the largest refined olive oil importing markets in the European Union were Italy ($246M), Spain ($214M) and Portugal ($119M), together accounting for 71% of total imports.
Spain, with a CAGR of +20.1%, recorded the highest rates of growth with regard to the value of imports, among the main importing countries over the period under review, while purchases for the other leaders experienced more modest paces of growth.
Import Prices By Country
In 2024, the import price in the European Union amounted to $7,433 per ton, growing by 30% against the previous year. Over the period under review, the import price enjoyed a strong expansion. The pace of growth appeared the most rapid in 2023 an increase of 54% against the previous year. The level of import peaked in 2024 and is likely to see steady growth in years to come.
Prices varied noticeably by country of destination: amid the top importers, the country with the highest price was Austria ($10,644 per ton), while Portugal ($6,320 per ton) was amongst the lowest.
From 2013 to 2024, the most notable rate of growth in terms of prices was attained by Spain (+11.4%), while the other leaders experienced more modest paces of growth.
ExportsEuropean Union’s Exports of Refined Olive Oil
Refined olive oil exports fell to 277K tons in 2024, declining by -8.5% compared with 2023 figures. Overall, exports, however, saw a relatively flat trend pattern. The most prominent rate of growth was recorded in 2020 when exports increased by 34% against the previous year. Over the period under review, the exports attained the peak figure at 418K tons in 2022; however, from 2023 to 2024, the exports failed to regain momentum.
In value terms, refined olive oil exports soared to $2.4B in 2024. Over the period under review, exports, however, recorded a strong increase. The most prominent rate of growth was recorded in 2022 when exports increased by 36% against the previous year. Over the period under review, the exports reached the peak figure in 2024 and are likely to see gradual growth in the immediate term.
Exports By Country
Spain was the major exporter of refined olive oil in the European Union, with the volume of exports finishing at 188K tons, which was near 68% of total exports in 2024. It was distantly followed by Italy (41K tons), Portugal (29K tons) and Greece (13K tons), together mixing up a 30% share of total exports.
Exports from Spain increased at an average annual rate of +1.9% from 2013 to 2024. At the same time, Portugal (+2.4%) displayed positive paces of growth. Moreover, Portugal emerged as the fastest-growing exporter exported in the European Union, with a CAGR of +2.4% from 2013-2024. By contrast, Greece (-1.9%) and Italy (-4.4%) illustrated a downward trend over the same period. While the share of Spain (+10 p.p.) and Portugal (+2 p.p.) increased significantly in terms of the total exports from 2013-2024, the share of Italy (-10.7 p.p.) displayed negative dynamics. The shares of the other countries remained relatively stable throughout the analyzed period.
In value terms, Spain ($1.6B) remains the largest refined olive oil supplier in the European Union, comprising 68% of total exports. The second position in the ranking was held by Italy ($403M), with a 17% share of total exports. It was followed by Portugal, with a 9.2% share.
From 2013 to 2024, the average annual rate of growth in terms of value in Spain amounted to +9.8%. The remaining exporting countries recorded the following average annual rates of exports growth: Italy (+2.7% per year) and Portugal (+6.9% per year).
Export Prices By Country
The export price in the European Union stood at $8,581 per ton in 2024, increasing by 33% against the previous year. Overall, the export price posted a resilient expansion. The most prominent rate of growth was recorded in 2023 an increase of 58%. Over the period under review, the export prices attained the maximum in 2024 and is likely to continue growth in the immediate term.
Average prices varied somewhat amongst the major exporting countries. In 2024, major exporting countries recorded the following prices: in Italy ($9,721 per ton) and Spain ($8,581 per ton), while Greece ($6,729 per ton) and Portugal ($7,575 per ton) were amongst the lowest.
From 2013 to 2024, the most notable rate of growth in terms of prices was attained by Spain (+7.8%), while the other leaders experienced more modest paces of growth.
Source: IndexBox Market Intelligence Platform