

Apr 21, 2025
IndexBox has just published a new report: U.S. – Olive Oil And Its Fractions – Market Analysis, Forecast, Size, Trends And Insights.
The United States market for olive oil is expected to continue growing over the next decade, with a forecasted CAGR of +0.9% in volume and +2.5% in value from 2024 to 2035. This growth is attributed to increasing demand for olive oil and its fractions, indicating a positive outlook for the industry.
Market Forecast
Driven by increasing demand for olive oil and its fractions in the United States, the market is expected to continue an upward consumption trend over the next decade. Market performance is forecast to decelerate, expanding with an anticipated CAGR of +0.9% for the period from 2024 to 2035, which is projected to bring the market volume to 310K tons by the end of 2035.
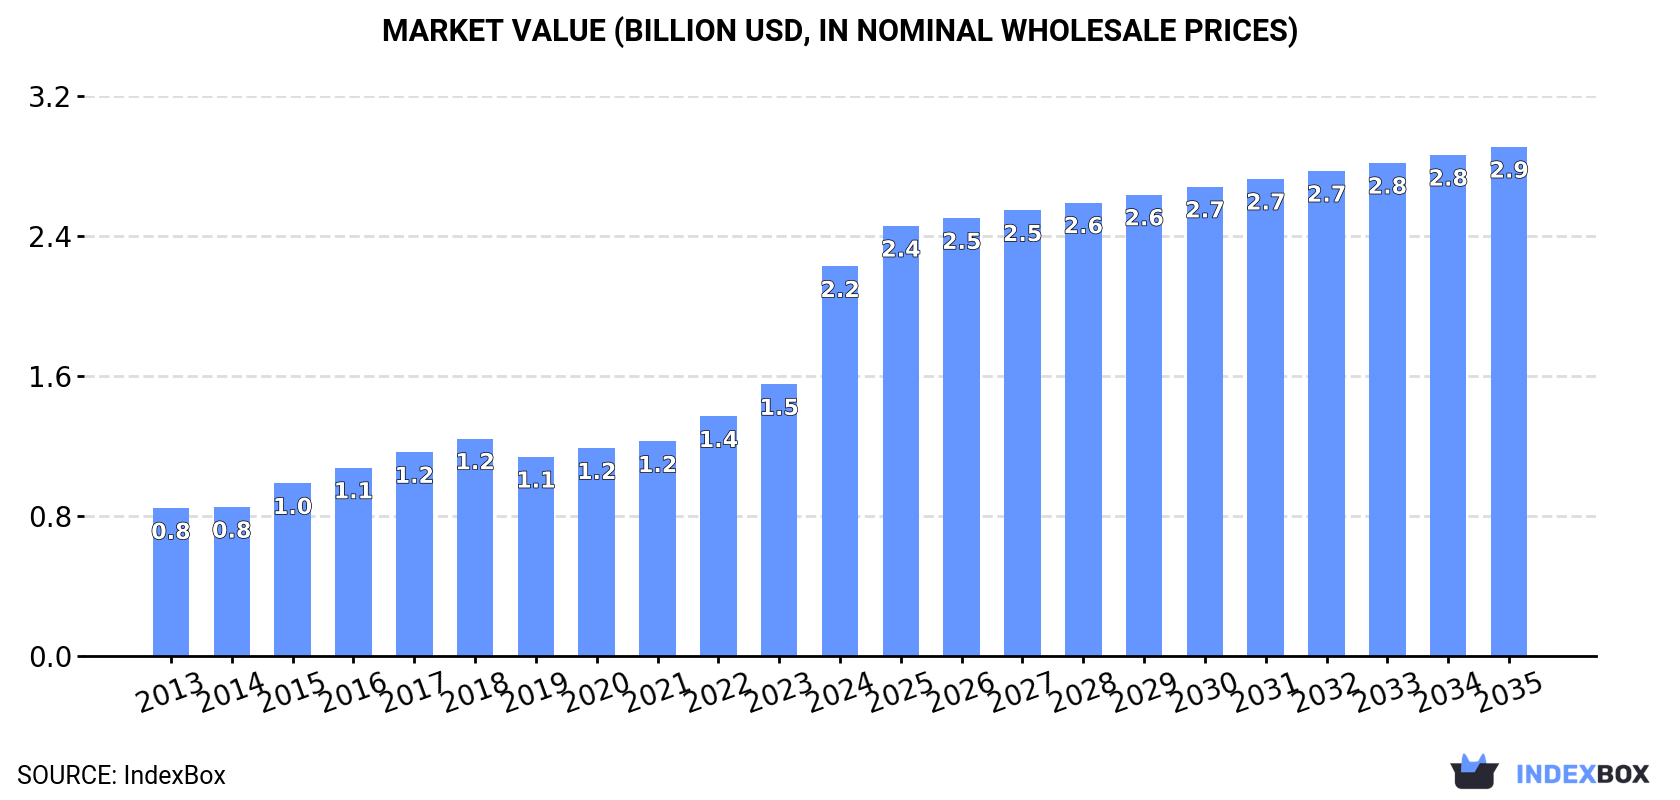
In value terms, the market is forecast to increase with an anticipated CAGR of +2.5% for the period from 2024 to 2035, which is projected to bring the market value to $2.9B (in nominal wholesale prices) by the end of 2035.
 ConsumptionUnited States’s Consumption of Olive Oil And Its Fractions
In 2024, approx. 280K tons of olive oil and its fractions were consumed in the United States; increasing by 5.6% on the previous year. The total consumption volume increased at an average annual rate of +3.4% over the period from 2013 to 2024; however, the trend pattern indicated some noticeable fluctuations being recorded in certain years. As a result, consumption reached the peak volume of 311K tons. From 2021 to 2024, the growth of the consumption remained at a lower figure.
The size of the olive oil market in the United States soared to $2.2B in 2024, surging by 43% against the previous year. This figure reflects the total revenues of producers and importers (excluding logistics costs, retail marketing costs, and retailers’ margins, which will be included in the final consumer price). Overall, consumption enjoyed a strong expansion. As a result, consumption reached the peak level and is likely to continue growth in the immediate term.
ProductionUnited States’s Production of Olive Oil And Its Fractions
Olive oil production in the United States was estimated at 16K tons in 2024, approximately reflecting 2023 figures. In general, the total production indicated perceptible growth from 2013 to 2024: its volume increased at an average annual rate of +4.4% over the last eleven-year period. The trend pattern, however, indicated some noticeable fluctuations being recorded throughout the analyzed period. Based on 2024 figures, production increased by +100.0% against 2014 indices. The most prominent rate of growth was recorded in 2015 when the production volume increased by 75% against the previous year. Over the period under review, production reached the peak volume in 2024 and is expected to retain growth in years to come.
In value terms, olive oil production contracted slightly to $57M in 2024. Over the period under review, the total production indicated a noticeable increase from 2013 to 2024: its value increased at an average annual rate of +3.0% over the last eleven-year period. The trend pattern, however, indicated some noticeable fluctuations being recorded throughout the analyzed period. Based on 2024 figures, production increased by +3.8% against 2022 indices. The growth pace was the most rapid in 2015 with an increase of 66% against the previous year. Over the period under review, production attained the peak level at $64M in 2017; however, from 2018 to 2024, production stood at a somewhat lower figure.
ImportsUnited States’s Imports of Olive Oil And Its Fractions
In 2024, imports of olive oil and its fractions into the United States expanded notably to 274K tons, increasing by 7.2% on 2023 figures. The total import volume increased at an average annual rate of +3.5% over the period from 2013 to 2024; however, the trend pattern indicated some noticeable fluctuations being recorded throughout the analyzed period. The pace of growth was the most pronounced in 2020 with an increase of 18% against the previous year. As a result, imports attained the peak of 300K tons. From 2021 to 2024, the growth of imports failed to regain momentum.
In value terms, olive oil imports skyrocketed to $2.5B in 2024. Overall, imports saw a resilient increase. As a result, imports reached the peak and are likely to continue growth in the immediate term.
Imports By Country
Italy (93K tons), Spain (88K tons) and Tunisia (51K tons) were the main suppliers of olive oil imports to the United States, with a combined 85% share of total imports. Turkey, Argentina, Greece and Portugal lagged somewhat behind, together comprising a further 11%.
From 2013 to 2024, the biggest increases were recorded for Portugal (with a CAGR of +18.6%), while purchases for the other leaders experienced more modest paces of growth.
In value terms, Italy ($887M), Spain ($846M) and Tunisia ($424M) appeared to be the largest olive oil suppliers to the United States, with a combined 86% share of total imports. Turkey, Argentina, Greece and Portugal lagged somewhat behind, together accounting for a further 10%.
Portugal, with a CAGR of +28.0%, saw the highest growth rate of the value of imports, among the main suppliers over the period under review, while purchases for the other leaders experienced more modest paces of growth.
Import Prices By Country
The average olive oil import price stood at $9,168 per ton in 2024, with an increase of 46% against the previous year. Overall, the import price continues to indicate strong growth. As a result, import price attained the peak level and is likely to continue growth in the immediate term.
Average prices varied somewhat amongst the major supplying countries. In 2024, amid the top importers, the highest price was recorded for prices from Greece ($9,784 per ton) and Spain ($9,628 per ton), while the price for Argentina ($7,698 per ton) and Turkey ($7,776 per ton) were amongst the lowest.
From 2013 to 2024, the most notable rate of growth in terms of prices was attained by Portugal (+7.9%), while the prices for the other major suppliers experienced more modest paces of growth.
ExportsUnited States’s Exports of Olive Oil And Its Fractions
In 2024, the amount of olive oil and its fractions exported from the United States surged to 10K tons, with an increase of 59% on the year before. Over the period under review, exports posted a prominent increase. As a result, the exports attained the peak and are likely to continue growth in the immediate term.
In value terms, olive oil exports soared to $32M in 2024. Overall, total exports indicated measured growth from 2013 to 2024: its value increased at an average annual rate of +4.1% over the last eleven-year period. The trend pattern, however, indicated some noticeable fluctuations being recorded throughout the analyzed period. Based on 2024 figures, exports increased by +95.4% against 2022 indices. As a result, the exports attained the peak and are likely to continue growth in the immediate term.
Exports By Country
Canada (6.5K tons) was the main destination for olive oil exports from the United States, with a 64% share of total exports. Moreover, olive oil exports to Canada exceeded the volume sent to the second major destination, Mexico (1.3K tons), fivefold. The third position in this ranking was taken by South Korea (383 tons), with a 3.8% share.
From 2013 to 2024, the average annual rate of growth in terms of volume to Canada amounted to +11.3%. Exports to the other major destinations recorded the following average annual rates of exports growth: Mexico (+14.4% per year) and South Korea (+61.3% per year).
In value terms, Canada ($19M) remains the key foreign market for olive oil and its fractions exports from the United States, comprising 59% of total exports. The second position in the ranking was held by Mexico ($3.7M), with an 11% share of total exports. It was followed by South Korea, with a 3.6% share.
From 2013 to 2024, the average annual rate of growth in terms of value to Canada amounted to +7.5%. Exports to the other major destinations recorded the following average annual rates of exports growth: Mexico (+14.5% per year) and South Korea (+53.3% per year).
Export Prices By Country
In 2024, the average olive oil export price amounted to $3,195 per ton, remaining constant against the previous year. Over the period under review, the export price showed a perceptible decrease. The most prominent rate of growth was recorded in 2021 an increase of 8.3%. The export price peaked at $4,479 per ton in 2014; however, from 2015 to 2024, the export prices failed to regain momentum.
Prices varied noticeably by country of destination: amid the top suppliers, the country with the highest price was Italy ($4,720 per ton), while the average price for exports to Panama ($1,764 per ton) was amongst the lowest.
From 2013 to 2024, the most notable rate of growth in terms of prices was recorded for supplies to Italy (+2.6%), while the prices for the other major destinations experienced more modest paces of growth.
Source: IndexBox Market Intelligence Platform