

Description of the study area
This study was conducted in Mekelle City, the capital city of Tigray region in northern Ethiopia, located approximately 780 km north of Addis Ababa, at a latitude of 12°16′ to 14° 49′ N and a longitude of 36° 27′ to 40° 00′ E. It has a total area of 41,409.95 km2 and is found at an altitude of 500–4000 m above sea level. Administratively, Mekelle has seven sub-cities (Fig. 1).
Fig. 1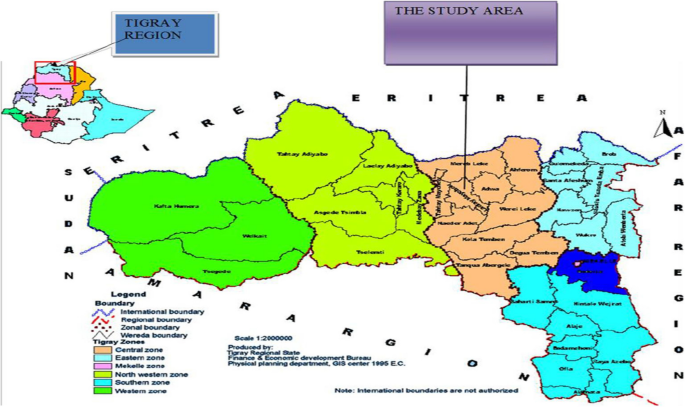
Study map Tigray indicting the entire national, regional, and sub-city level setups, 2022
The total population of Mekelle is approximately 555,769 people, along with 126,323 households. Women constitute around 51.4% of the population, while men make up about 48.6%. In Ethiopia, female-headed households account for 24% of the total. In Mekelle, this results in approximately 30,317 female-headed households and 96,006 male-headed households. The primary sources of livelihood for the residents of the city include trade, manufacturing, and employment in both governmental and non-governmental organizations [20].
The study approach, data types, and sources
The study approach used was a cross-sectional study assessing food crises and coping strategies in war-affected communities in Tigray, Ethiopia. This includes the use of cross-sectional study designs to gather data from households affected by the ongoing conflict. To evaluate food shortage through structured interviews and assessments of coping strategies. The data type used is primary data collected through household surveys and semi-structured questionnaires.
Study design and participants
A community-based cross-sectional study was conducted among the residents of Mekelle city. The source population, sample population, and sample unit included all households in seven sub-cities, selected households, and a single household head, respectively.
Sample size determination and sampling procedureSample size determination
A total of 315 households were included in this study. The sample size was computed using a single population proportion formula,
$$n=\frac{{z}^{2} pq}{{d}^{2}}$$
Considering the 87% proportion of household food shortage coping strategies used by Eastern Tigray residents [9], 95% confidence level, 4% margin of error, and 10% nonresponse rate, the final sample size was 315. Mekelle City was purposefully selected due to accessibility and budget constraints, and the other zones were in conflict. The researchers understood that the impact of the war and siege was not limited to Mekelle, but for accessibility reasons, the study was conducted in Mekelle. Accessibility to other areas was quite difficult due to logistic issues following the siege.
Sampling procedure
Samples were collected from the seven sub-cities of Mekelle residents; all sub-city households were considered for sample selection, and the final sample size was allocated proportionally based on the number of total households per sub-city. Finally, the proportionally allocated sample was selected using a simple random sampling technique (Fig. 2).
Fig. 2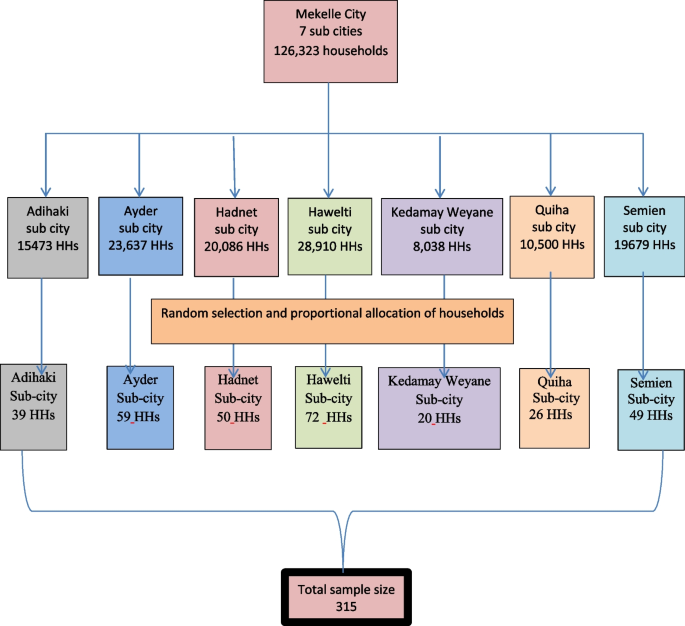
Schematic presentation of sampling procedure for study households of the seven sub-cities of Mekelle zone, Tigray, Ethiopia, 2022
Data collection procedure
A structured interviewer-administered questionnaire was utilized. Efforts were made to ensure that the questions were suitable for the local context. The questionnaire was initially prepared in English and later translated into Tigrigna. A back translation into English was conducted to compare the consistency, and amendments were made as needed.
Five data collectors were selected, each holding a bachelor’s degree: two in economics, two in public health, one as a dietitian, and one as a biotechnologist. Additionally, there were two supervisors with master’s degrees in public health nutrition. Both the data collectors and supervisors underwent a two-day training session. This training took place at the College of Health Sciences before the pre-test was conducted.
The questionnaire was pre-tested on a sample of 5% of a similar population, ensuring socio-cultural similarities, but was conducted in a different location to prevent information contamination. It was designed to collect data on household socio-demographics, food situations, and livelihood sources both before the war and during the siege. Additionally, it included questions regarding household coping strategies used to sustain lives during the full-scale siege in the study area. The study was conducted from May 20 to June 5, 2022.
Moreover, qualitative data were also collected via four in-depth interviews to narrate the food storage and consumption-based coping mechanisms adopted during the Tigray War and the complete siege in the study area.
Data analysis and presentation
Data were entered, edited, cleaned, and analyzed using a statistical software package, Stata version 14. Data were analyzed using descriptive statistics, t-tests, and the coping strategy index. In the descriptive statistics, mean, standard deviation, percentage, and graphic analysis were used to summarize the profiles and responses of the surveyed households. We used a reduced coping strategy index to summarize food rationing and coping strategies adopted to sustain life during the full-scale siege of Tigray. A t-test was applied to compare the mean difference of the coping strategies adopted by the urban residents in response to the severe food crisis faced during the complete siege. The qualitative data were analyzed using narrative analysis to triangulate the information generated through the quantitative analysis.
The Reduced Coping Strategy Index (rCSI): In times of man-made and natural shocks, households have adopted different consumption-related mechanisms to cope with challenges and sustain life. In line with this, we used rCSI as a proxy variable to measure the extent of the food shortage among households in Mekelle city during the siege. Technically, rCSI is calculated by multiplying the self-reported frequency of each food consumption-related strategy (how many times each strategy was adopted in a specified time) and severity (how serious each strategy is in the eyes of the respondent). Technically, a higher rCSI value indicates a worse food shortage situation and vice versa. Finally, the rCSI score is computed using [21] given in Eq. (1).
$$CSI = \sum\limits_{i = 1}^{i = 15} {FCS_{i} *} SCS_{i}$$
(1)
where \(FSC_{i}\) denotes the frequency of the ith food consumption-related strategies adopted by the surveyed household and \(SCS_{i}\) signifies the severity of the strategies to sustain life during the siege. This is also in the revised manuscript.