
Subject enrolment and clinical evaluation
Fourteen Saharawi children, with biopsy-confirmed celiac disease, being treated with a gluten-free diet for at least two years and following an African-style diet, were enrolled (Table S1). The percentage of Saharawi celiac children who had borderline/positive values for tissue transglutaminase antibody and anti-endomysial antibodies was high (42.85 and 50%, respectively). The mean values for other clinical parameters were within the normal range. The Saharawi celiac children were treated with an Italian-style gluten-free diet for 60 days. The African-style diet was rich in gluten-free cereals, legumes and vegetables and had high carbohydrate, fibre and non-animal protein contents (Table S2). Depending on age, the number of calories consumed ranged from 672 to 996 kcal/d. The Italian-style diet was a typical Western omnivore diet, including animal proteins, sugars, starch, fat and fibres (Table S2).
Saliva samples were collected and analysed for the microbiota and metabolome of Saharawi celiac children. As estimated by plate count on selective media, Bacteroidetes increased (P = 0.0007) in saliva samples of Saharawi celiac children during the intervention with Italian-style gluten-free diet compared with the African-style gluten-free diet (Table S3).
The Italian-style gluten-free diet induced a decrease in salivary microbial diversity
The microbial composition of salivary samples of Saharawi celiac children was analyzed by pyrosequencing of 16S rRNA gene. The bacterial community richness and alpha diversity measures were determined (Figure S1). The analysis revealed a significant decrease in microbial diversity after 30 days of treatment with an Italian-style gluten-free diet. A re-increasing trend was noted after 60 days, although the diversity values were still significantly lower than those registered before the diet change.
Diet influenced the composition of the salivary microbiota
Firmicutes, Actinobacteria and Tenericutes significantly decreased, whereas Proteobacteria increased (P = 0.00041) in the saliva of Saharawi celiac children after 60 days on an Italian-style gluten-free diet (Figure S2). No significant (P > 0.050) differences were identified for the other phyla. The saliva samples of Saharawi celiac children on an Italian-style gluten-free diet were clearly differentiated as shown by the principal coordinates analysis based on unweighted Unifrac distances (Fig. 1). In addition, both Adonis and Anosim statistical tests based on Unifrac distance matrices indicated a significant influence of diet on the microbial diversity (False Discovery Rate, FDR, < 0.050).
Figure 1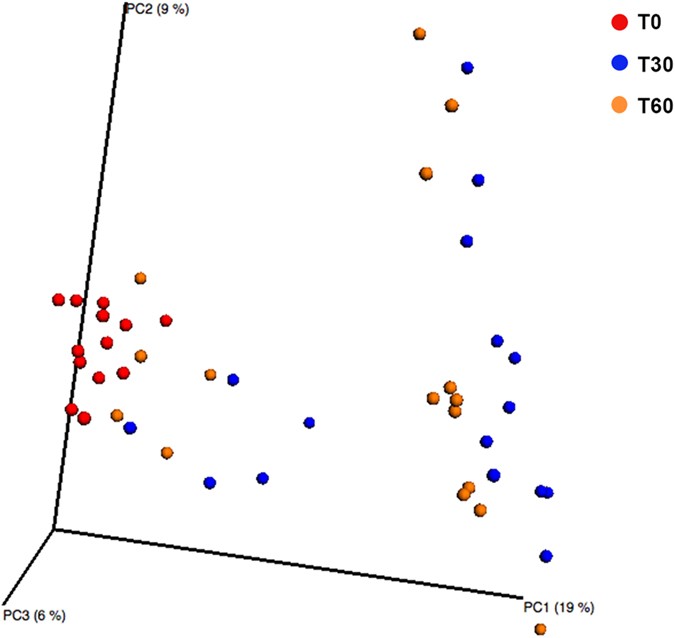
Principle Coordinate Analysis (PCoA).
The analysis was based on unweighted UniFrac distance matrix of all 16S rRNA gene sequences found on salivary samples of Saharawi celiac children under African-style gluten-free (T0) and after 30 (T30) and 60 (T60) days of intervention with Italian-style gluten-free diet.
Many significant differences in relative abundance of bacterial genera/species were associated with the diet change (Fig. 2, Figure S3). Within Firmicutes, the abundance of some bacteria belonging to Clostridiales FamilyXIII IncertaeSedis (e.g., Eubacterium, Mogibacterium), Gemellaceae (Gemella), Lachnospiraceae (e.g., Butyrivibrio, Catonella, Clostridium), Peptococcaceae (Peptococcus), Peptostreptococcaceae (Filifactor, Peptostreptococcus) and Veillonellaceae (Selenomonas, Veionella) significantly decreased during treatment with the Italian-style gluten-free diet compared with the African-style gluten-free diet. By contrast, Carnobacteriaceae (Granulicatella) markedly increased under treatment with the Italian-style gluten-free diet. Within the phylum Bacteroidetes, the abundance of Flavobacteriaceae (genus Capnocytophaga) and Porphyromonadaceae (Porphyromonas) significantly increased with the Italian-style gluten-free diet. An opposite trend was observed for bacteria belonging to Prevotellaceae (Prevotella). Compared with the African-style gluten-free diet, the abundance of some bacteria belonging to Burkholderiaceae and Neisseriaceae (Neisseria) markedly increased after 60 days of treatment with the Italian-style gluten-free diet.
Figure 2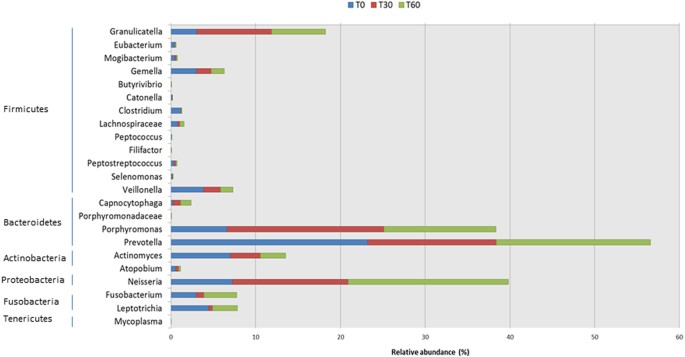
Relative abundance (%) of genera.
Relative proportions (%) of predominant bacteria, which showed significant (P < 0.050) differences between the salivary samples of Saharawi celiac children under African-style gluten-free diet (T0) and after 30 (T30) and 60 (T60) days of intervention with Italian-style gluten-free diet.
Operational taxonomic unit (OTU) co-occurrence was investigated by considering the family- (Figure S4) or genus-level (Figure S5) taxonomic assignments and significant correlations at FDR < 0.050. The highest positive correlations were noted between Actinomycetaceae and several families belonging to Firmicutes (e.g. Clostridiales family XIII). In addition, the most significant co-exclusion patterns were identified for Neisseriaceae/Neisseria, Porphyromonas and especially Granulicatella, which co-excluded many other different genera.
The salivary microbiome of Saharawi celiac children still differed from those of Italian celiac and healthy children after eating an Italian-style gluten-free diet
Regardless of the relative abundance, a core salivary microbiome (genus level) was commonly observed in >98% of the Saharawi celiac children both before and after treatment with the Italian-style gluten-free diet (this study) and this core microbiome was similar to those reported in Italian celiac and healthy children in a recent study (Table S4)23. This core salivary microbiome consisted of 15 genera belonging to the phyla Firmicutes (Gemella, Granulicatella, Mogibacterium, Streptococcus and Veillonella), Bacteroidetes (Porphyromonas, Prevotella and Capnocytophaga), Proteobacteria (Neisseria, Haemophilus), Fusobacteria (Fusobacterium and Leptotrichia), Actinobacteria (Actinomyces) and Tenericutes (Bulleidia). The core microbiome of Saharawi celiac children also included other nine genera (Abiotrophia, Atopobium, Catonella, Clostridium, Eubacterium, Oribacterium, Peptostreptococcus, Rothia and Selenomonas). A partitioning around medoid cluster analysis of saliva samples was performed and the Calinski-Harabasz index indicated that three was the optimal number of clusters (Fig. 3). Supervised clustering methods may force the separation and these clusters are intended as continuous distribution of subjects rather than discrete entities24. With this caveat in mind, partitioning around medoids clustering may be still useful to understand which OTUs drive the stratification of the subjects. The abundance of the core genera allowed stratifying the children into three “salivary types”. Cluster I was characterised by a high abundance of Haemophilus, Veillonella and Leptotrichia. Cluster II was distinguished by Porphyromonas, Granulicatella and Neisseria and cluster III by Streptococcus, Actinomyces, Peptococcus and Clostridia. The three “salivary types” were significantly different using Adonis (P < 0.001) and Anosim (P < 0.001). Significant (P < 0.050) associations were identified between subject type (Italian healthy children, Italian and Saharawi celiac children) and “salivary type”. Cluster I included only saliva samples from Italian healthy and celiac children23. The saliva samples of Saharawi celiac children were grouped into clusters II and III. These two clusters mainly differed based on dietary habits. Cluster III mainly contained saliva samples of Saharawi celiac children treated with an African-style gluten-free diet (85, 29 and 21% of samples taken at 0, 30 and 60 days of diet intervention, respectively). Cluster II contained saliva samples after 30 (71%) and 60 (79%) days of treatment with the Italian-style gluten-free diet. Unweighted Unifrac analysis revealed a clear differentiation between the salivary microbiota of Saharawi and Italian celiac children, which remained sharp even after treatment with an Italian-style gluten-free diet (Figure S6).
Figure 3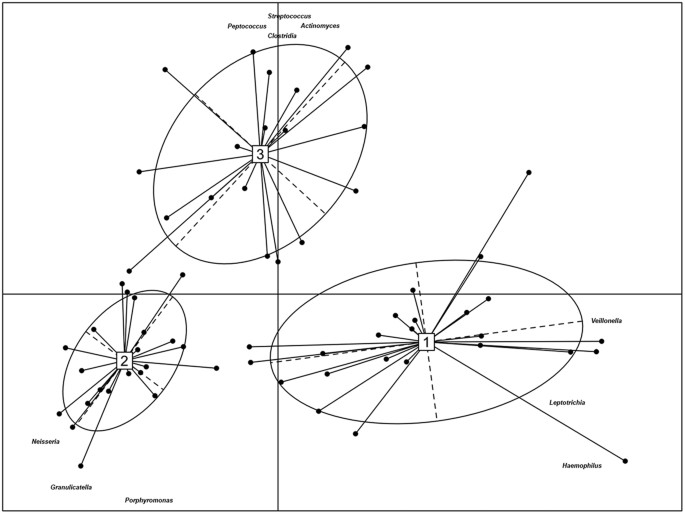
Operational taxonomic unit abundance drives the differentiation of salivary types.
Between-class analysis visualizing the results from Principal Component Analysis and clustering based on the Jensen-Shannon distance of the saliva samples analyzed in this study. The center of gravity for each cluster is marked by a rectangle indicating the salivary type and the ellipse covers 67% of the samples belonging to the cluster. Only operational taxonomic units with loadings >=0.7 in at least one cluster are shown in the figure.
Diet-induced changes in the predicted metabolic functions of the salivary microbiota
Using the phylogenetic investigation of communities by reconstruction of unobserved states, (PICRUSt, http://picrust.github.io/picrust/) as a predictive tool, the potential functions were determined by retrieving the metagenomes. The weighted nearest sequenced taxon index for the samples was 0.074 ± 0.027, indicating a satisfactory level of accuracy for a potential phylogenetic investigation of communities by reconstruction of unobserved states prediction. It was found that human-associated samples have the lowest (best) nearest sequenced taxon index values (0.03 ± 0.20), thanks to the wide number of sequenced genomes available. Other mammalian guts have a higher mean nearest sequenced taxon index value (0.14 ± 0.06) and diverse communities, such as soil, also have much higher nearest sequenced taxon index values (0.17 ± 0.02)25. The metagenome prediction confirmed the remarkable effects of the diet change not only on the microbial community composition, but also at a potential functional level. The saliva samples from children on an African diet (T0) could be clearly distinguished from the samples taken after 30 and 60 days of an Italian-style gluten-free diet (Fig. 4). Considering the genes assigned to metabolic functions, the saliva samples at T0 had a higher abundance of genes related to carbohydrate metabolism, whereas after the diet change, the saliva was characterised by a higher abundance of genes related to the metabolism of amino acids, vitamins and cofactors. A procrustes analysis was used to co-visualise the Principal Coordinates Analysis from the 16S-based community structure and predicted metagenomes (Figure S7). In this type of analysis, if the two matrices are perfectly superimposable, the same sample separation can be achieved by using both the datasets. Although the two the Principal Coordinates Analyses were not perfectly superimposable, the procrustes analysis in our case showed that the separation of the samples achieved both at OTU composition and at functional levels was driven by the diet and the length of treatment, with the samples at T0 clustering separately from treated samples.
Figure 4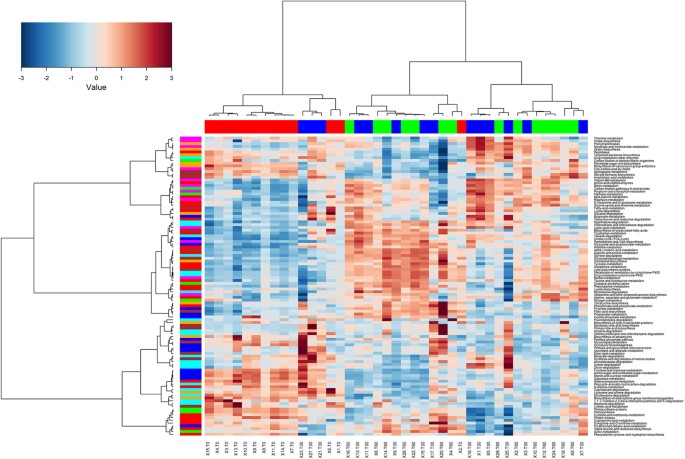
Hierarchical Ward-linkage clustering.
The analysis was based on the Spearman correlation coefficients of the proportion of KEGG Orthologs collapsed at level 3 of hierarchy, filtered for subject prevalence of at least 20%. Column bar is color-coded by the time of treatment: subjects under African-style gluten-free diet (t0, red) and after 30 (blue) and 60 (green) days of Italian-style gluten-free diet. Row bar colors denote the higher level of hierarchy (L2): carbohydrate (blue), amino acid (red), energy (green), cofactors and vitamins (magenta), terpenoids and polyketides (orange), lipid (brown) and xenobiotics (cyan) metabolism. Only KEGG Orthologs belonging to metabolism category were considered. The color scale represents the scaled abundance of each gene, denoted as Z-score, with red indicating high abundance and blue indicating low abundance.
Diet influenced the salivary metabolome
Salivary volatile organic compounds were analysed by gas-chromatography mass spectrometry-solid-phase microextraction. Overall, the concentrations of volatile organic compounds increased after 30 and, especially, 60 days of treatment with an Italian-style gluten-free diet (Figure S8). However, the median values for some volatile organic compounds, such as alcohols and phenols (mainly 1-propanol, 4-(1,1,3,3-tetramethylbutyl)-phenol and phenol), aldehydes (heptanal, octanal and nonanal), aromatic heterocyclics (2-pentyl furan) and some hydrocarbons (1,3-bis 1,1-dimethylethyl-benzene; 1-chloro decane; 1-octadecene, benzene and trichloromethane) were significantly (P < 0.050) lower in Saharawi celiac children after 30 and, especially, 60 days of treatment with an Italian-style gluten-free diet (Table S5). Ketones (acetone, 2-butanone and 3-methyl-butanone) noticeably increased during treatment with an Italian-style glute-free diet. Permutation and Principal Component Analysis analyses based on gas-chromatography mass spectrometry data clearly distinguished the saliva samples of Saharawi children according to diet (Figs 5 and 6).
Figure 5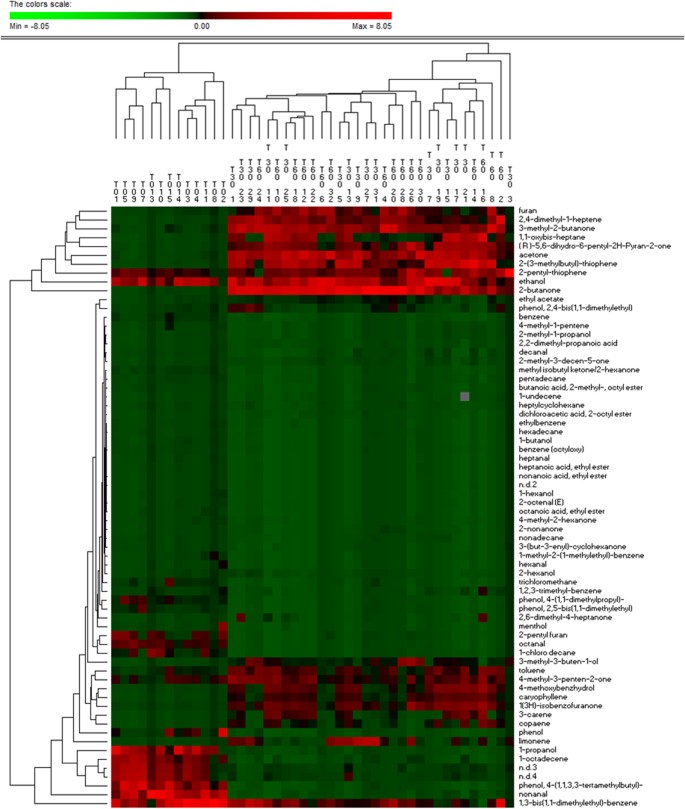
Permutation analysis of volatile organic compounds.
Volatile organic compounds were found on salivary samples of Saharawi celiac children under African-style gluten-free diet (T0) and after 30 (T30) and 60 (T60) days of intervention with Italian-style gluten-free diet.
Figure 6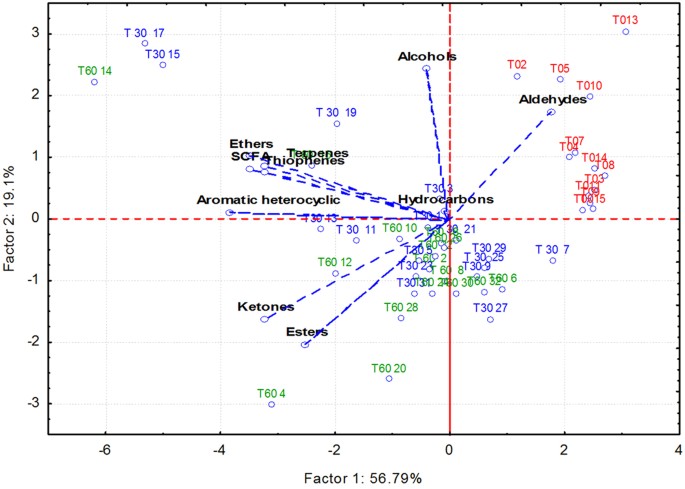
Score plots of the two principal components after Principal Component Analysis of volatile organic metabolites, which were found on salivary samples of Saharawi celiac children under African-style gluten-free diet (T0, red characters) and after 30 (T30, green) and 60 (T60, blue) days of intervention with Italian-style gluten-free diet.
All the variables used were listed in Supplementary Table 2. Children were numbered.
Diet influenced the OTU-metabolite correlations
Overall, the OTU-metabolite correlations changed during treatment with an Italian-style gluten-free diet. For instance, Actinomyces, which had the highest abundance in saliva samples of Saharawi celiac children on an African-style gluten-free diet, showed positive correlations (FDR < 0.050) with volatile organic compounds that were found before and after 30 days of an Italian-style gluten-free and negative correlations with other volatile organic compounds detected at 60 days (Figure S9). Genera with the highest abundance during intervention with the Italian-style gluten-free diet showed negative correlations (FDR < 0.050) with some antimicrobial compounds, which were detected at the highest levels in the saliva samples of Saharawi celiac children on an African-style gluten-free diet (e.g., Porphyromonas and Neisseria versus nonanal) (Figure S9, panel T0). By contrast, genera abundantly associated with an African-style gluten-free diet were negatively correlated with the volatile organic compounds mainly detected under treatment with an Italian-style gluten-free diet (e.g., Clostridium versus furan and Eubacterium versus ethyl acetate) (Figure S9, panel T30).
Correlations between diet, microbiota and metabolome
Plotting the correlation between genera and dietary information, an influence of the diet on the structure of the microbiota could be detected (Fig. 7). Two major clusters of genera and two clusters of nutritional ingredients were detected. Within Bacteroidetes, Porphyromonadaceae (Porphyromonas) and Capnocytophaga showed negative correlations with carbohydrates and, especially, fiber intake and positive correlations with proteins, iron, calcium, phosphorus, caloric intake and/or lipids. Similar trend was also found for Neisseria (Proteobacteria) and Granulicatella (Firmicutes). An opposite trend was found for other Firmicutes such as Veillonellaceae (Veionella), Streptococcus, Catonella, Mogibacterium, Clostrium, Peptococcus and Gemella and Actinobacteria (Actinomyces).
Figure 7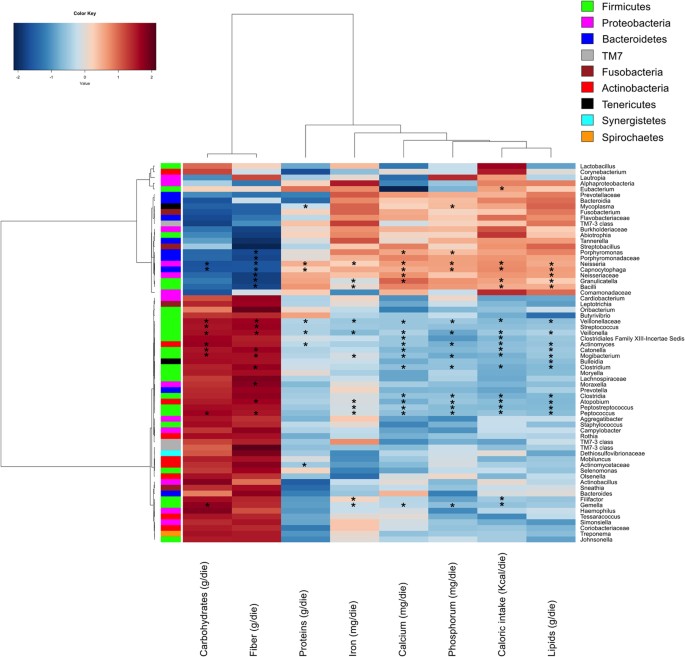
Correlation between dietary information and salivary microbiota composition.
Heatplot showing Spearman’s correlations between microbial genera (filtered by a subject prevalence of 5%) and dietary information. Rows and columns are clustered by Euclidean distance and Ward linkage hierarchical clustering. The intensity of the colours represents the degree of association between the genera and the nutrients as measured by the Spearman’s correlations. Row bar is colour-coded by phylum. Asterisk indicates significant correlations after p-value correction (FDR < 0.05).
Carbohydrates, fiber and caloric intakes strongly correlated (R > 0.7) with several hydrocarbons (P < 0.001) (benzene, tricholoromethane and 1-octadecene), aldehydes (P < 0.003) (heptanal, nonanal and octanal) and alcohols (P < 0.045) (1-butanol, 1-propanol and phenol) (Figure S10). Calcium, phosphorum and iron intakes showed the highest positively correlations (R > 0.7) with furans (P < 0.031), acetone (P < 0.002), ethyl acetate (P < 0.002), 2-butanone (P < 0.006) and 3-methyl-2-butanone (P < 0.009). Furans, acetone, ethyl acetate, 2-butanoneand 3-methyl-2-butanone were also correlated (R > 0.54; P < 0.042) with the intake of proteins. Lipids were strongly correlated with acetone (R = 0.764; P = 0.001) and toluene (R = 0.617, P = 0.032).