

The prospective cohort study was conducted over 5 years from January 2020 to December 2024 by following STROBE guidelines. The study involved 1500 subjects, males and females, via non-probability convenience sampling and divided them into healthy controls (n = 750) and Alzheimer’s disease (AD, n = 750). The sample size calculated with the WHO calculator was 144, with a prevalence of 10.4%18, 95% confidence interval, and 5% margin of error, but we recruited 1500 subjects.
Sample selection
The inclusion criteria for both groups were subjects aged ≥ 50–75 years without severe comorbidities and who could follow dietary interventions. Specific inclusion for both groups were as follows;
Inclusion criteria for Alzheimer’s disease patients
Participants were evaluated using the National Institute on Aging and Alzheimer’s Association (NIA-AA), diagnostic criteria for AD19, which were based on a comprehensive assessment including medical history, cognitive testing (MMSE < 24 or MoCA < 26), neuroimaging (MRI showing hippocampal atrophy), and biomarker analysis (elevated amyloid-beta and tau levels). Diagnosis was made by a board-certified neurologist to ensure clinical validity.
Inclusion criteria for healthy controls
Participants with no subjective or objective cognitive complaints. They had MMSE ≥ 27 and MoCA ≥ 26 scores at baseline. Neuroimaging showed no evidence of hippocampal atrophy or other structural abnormalities.
Exclusion criteria
Subjects with a history of stroke, severe psychiatric illness, or non-compliance with dietary tracking were excluded from the study.
Data collection
Ethical approval was granted by the ethical committee of Huadu District People’s Hospital of Guangzhou, and all methods were conducted according to STROBE guidelines. The Declaration of Helsinki was followed to obtain informed consent from research participants. Demographics including lifestyle data, dietary assessment, cognitive function testing, along with biomarker levels, neuroimaging, and gene analysis were taken at baseline (Enrollment phase), while dietary intake monitoring, cognitive function testing, biomarker levels, and neuroimaging were taken at 6 monthly follow-ups (1, 2, 3, 4, 5). The number of participants presented at each follow-up, along with dropouts, is presented in Fig. 1.
Fig. 1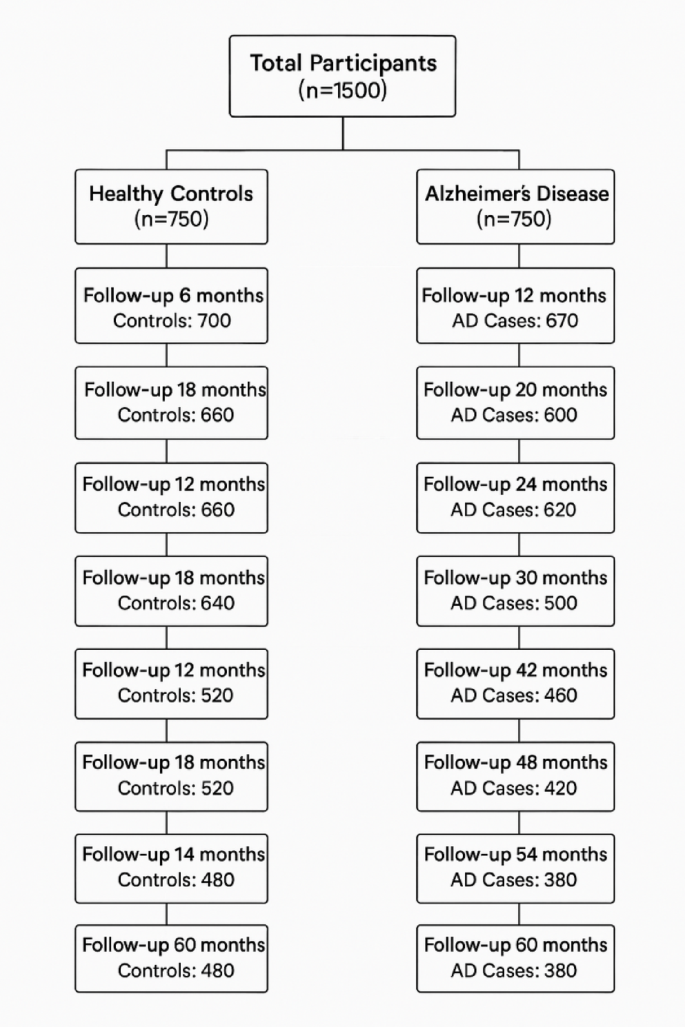
Patient count from baseline to end of research. Patients who didn’t come for follow-up they were called, and non-responsiveness was the major factor for elimination.
Dietary assessment was done by a food frequency questionnaire (FFQ) that included self-reported dietary intake over the past 12 months, a 24-hour dietary recall (multiple recalls over different seasons to reduce bias), Mediterranean Diet Adherence Screener (MEDAS, 4–15 scale), MIND Diet Score (4–15 scale). Cognitive function testing was done with the help of the Mini-Mental State Examination (MMSE, 18–30) and, Montreal Cognitive Assessment (MoCA Score, 18–30).
The MMSE and the MoCA were both used to evaluate cognitive function to enhance diagnostic sensitivity across the cognitive spectrum. MMSE is a widely used screening tool for moderate-to-severe cognitive impairment; it is less sensitive to mild cognitive impairment (MCI) and executive dysfunction. The MoCA includes more complex tasks involving visuospatial skills, attention, and executive function, making it more suitable for detecting early cognitive decline, therefore the current study utilized both to identify the cognitive decline in response to diet adherence.
Biomarker analysis: 3 ml of Blood and CSF samples was taken for biomarker (Amyloid-beta (Aβ, 42/40 levels, normal range 200–800 pg/mL, Thermo Fisher Scientific (Invitrogen) ELISA Kit, Catalog Number: KHB3481, Sensitivity: < 10 pg/mL, Range: 50–5000 pg/m), Tau Protein Levels (50–150 pg/mL, Cat No: DTA00, R&D Systems, Sensitivity: 5 pg/mL, Range: 50–1000 pg/m), Neurofilament Light Chain ((NfL), 10–50 pg/mL, Cat No: 42-1001, Peninsula Laboratories, Sensitivity: 0.1 ng/mL, Range: 0.1–100 ng/mL), C-reactive protein (CRP, normal range: 0.2-5.0 mg/L, • Catalog Number: CRP-001, Cloud-Clone Corp, Sensitivity: < 0.05 mg/L, Range: 0.1–50 mg/L), Interleukin-6 (IL-6, 1–15 pg/mL), Tumor Necrosis Factor-alpha (TNF-α, 1–20 pg/mL) Polyphenols, Omega3 and Vitamins B 12), from commercially available eBioscience (Thermo Fisher Scientific) Kits.
For neuroimaging, an MRI Scan for Hippocampal volume (2.0-4.5 mL), cortical thickness (1.8–3.2 mm) was done for AD progression tracking at the enrollment phase and end of study. Figure 2.
Fig. 2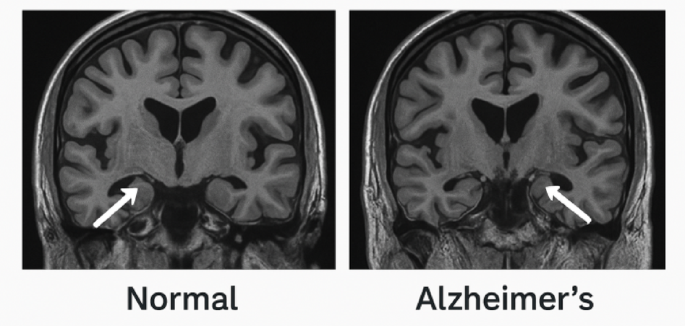
Comparison of Hippocampal volume and critical thickness in MRI scan of a normal patient with Alzheimer’s.
Polymerase chain reaction for APOE-ε4
For personalized dietary recommendations, the presence/ absence status was checked with gene analysis by PCR. 10 mL of peripheral blood samples from each participant was collected in EDTA tubes. DNA is extracted from the blood using the QIAamp DNA Blood Mini Kit (Qiagen), following the manufacturer’s instructions, which involves lysis of blood cells and precipitation of DNA. Once the DNA is isolated, PCR amplification was performed using specific primers designed for the rs429358 and rs7412 polymorphisms in the APOE gene. The primers used were F4 (5’-ACAGAATTCGCCCCCCGGCCTGGTAACACACAC-3’) and F6 (5’-AAGCITGGCACGGCTGn = cAAG’-3’), which target the regions of interest in exon 4 of the APOE gene that determine the ε2, ε3, and ε4 isoforms. The PCR reaction was set up with GoTaq Green Master Mix (Promega), dNTPs, Taq DNA polymerase, and PCR-grade water, and amplified in a thermal cycler with 30 cycles of denaturation, annealing, and extension. After amplification, the PCR products were treated with the HhaI restriction enzyme (New England Biolabs), which specifically cleaves the DNA at sites related to the APOE-ε4 allele, producing fragments that were visualized through gel electrophoresis on a 2% agarose gel stained with ethidium bromide. The resulting banding patterns allowed for the identification of the APOE-ε4 allele; ε4/ε4 and ε3/ε4 genotypes. Finally, the genotyping results were interpreted to classify participants as APOE-ε4 positive (those with the ε4 allele) or APOE-ε4 negative, which is essential for understanding the genetic basis of Alzheimer’s disease and providing personalized dietary recommendations based on genetic risk factors.
Based on APOE-ε4 status, participants were stratified into APOE-ε4 carriers and non-carriers. Personalized dietary recommendations were provided accordingly. For APOE-ε4 positive individuals, diet was advised with greater quantities of omega-3 fatty acids (e.g., from fatty fish), antioxidants (e.g., berries, leafy greens), and polyphenol-rich foods (e.g., olive oil, nuts, turmeric). These components were selected due to evidence that ε4 carriers may have greater vulnerability to lipid dysregulation, oxidative stress, and neuroinflammation20. Non-carriers were also encouraged to follow Mediterranean or MIND dietary principles, but without targeted emphasis.
After baseline recordings and dietary recommendations, a 6-monthly follow-up plan was recommended for recording dietary intake (Participants log daily dietary intake via a mobile dietary tracking app, and AI-powered machine learning algorithms analyze adherence trends) and cognitive functioning. MRI scans were done at the start and end of the research to monitor disease progression.
Machine learning application
To explore dietary adherence and predict cognitive outcomes, we applied supervised and unsupervised machine learning. A random forest classifier was trained to predict 5-year cognitive impairment (MMSE < 24) using baseline features including MIND/MeDi scores, age, sex, education, APOE-ε4 status, and baseline MMSE. Performance was evaluated using 5-fold cross-validation, with metrics including accuracy, F1-score, AUC, and feature importance. K-Means clustering was used to identify patterns of dietary adherence over time based on longitudinal MIND and Mediterranean diet scores. The optimal number of clusters was determined using silhouette scores, and clusters were interpreted as distinct adherence trajectories. Further model outputs and ML details are provided in supplementary file 1.
Data analysis
Data was analyzed using SPSS version 26.0. The data followed a normal distribution, as checked by Kolmogorov. Multiple imputation (mean-based strategy for continuous variables) was done to deal with missing data and compared with complete case analysis (CCA) to analyze any bias. This was further checked by a sensitivity analysis to make sure attrition or missingness may not affect the final results. Descriptive variables were expressed as mean ± SD and min-max range. Group comparisons were made using an independent samples t-test. To assess the long-term neuroprotective effects of the Mediterranean (MeDi) and MIND diets on cognitive function, adherence scores to these diets were compared with MMSE scores for longitudinal tracking. Dietary adherence and cognitive decline were evaluated with the Spearman correlation between dietary adherence scores and biomarker levels, and the relationship between micronutrients, cognitive functions, and inflammation was examined. Multivariate linear regression was performed to account for potential confounding variables using the backward method. Cognitive scores (MMSE, MoCA) were taken as the dependent variable. Independent variables included adherence scores to the Mediterranean and MIND diets, while covariates included age, sex, education level, and APOE ε4 status. A p-value of < 0.05 was considered statistically significant. Linear mixed effect models (LMMs) were employed to account for the repeated measures & inter-subject variability across the 5 years. MMSE and MoCA scores were modeled as dependent variables in separate LMMs, with timepoint, MIND diet score, Mediterranean diet score, age, sex, education level, and APOE-ε4 status as fixed effects, and participant ID as a random intercept to account for individual differences. Models were fitted using restricted maximum likelihood (REML) estimation. The same framework was used to model changes in neurodegenerative biomarkers (amyloid-beta, tau, and NfL), and inflammatory markers (CRP, IL-6, TNF-α) over time. False discovery rate (FDR) correction using the Benjamini-Hochberg procedure was applied to control the potential inflation of type 1 error due to multiple comparisons across cognitive and biomarker outcomes. Adjusted p-values were calculated across fixed effects in the LMMs for MMSE and MoCA. (see supplementary file1, Table S1–S3) To identify adherence trends, K-Means clustering on MIND/MeDi over time was done. To predict cognitive impairment, a Random forest classifier was used, and to determine the trajectory of cognitive decline, the MMSE slope by cluster was employed (Supplementary file 2, Fig. S1–S3).
Dining and Cooking