
Study design
This study is a prospective cohort investigation conducted among Iranian pregnant women from October 2022 to May 2023. Patients were recruited from outpatient healthcare centers or Yas Hospital, affiliated with the Tehran University of Medical Sciences through a simple random sampling technique. Primarily, 300 individuals participated in this cohort. We included pregnant women in the third trimester of pregnancy (24 to 40 weeks), aged ≥ 18, and having a singleton pregnancy. We excluded women who had hepatitis, tumors (malignancies), severe infections, HIV/AIDS, and other autoimmune diseases. Also, we excluded participants who had used corticosteroids, immunosuppressive drugs, and neurologic medications, subjects who had implausible energy intake (< 800 or >4200 kcal/day) (n = 10)19 and history of GDM or diabetes (n = 16). In next step, 274 pregnant women met the inclusion criteria which 31 pregnant women had not information for infant gender. Eventually, 243 pregnant women included in final analysis (Fig. 1). The study protocol was endorsed and granted by the Tehran University of Medical Sciences Research Ethics Committee (IR.TUMS.MEDICINE.REC.1400.1406). All participants provided written informed consent. This study followed the ethical guidelines outlined in the Declaration of Helsinki.
Fig. 1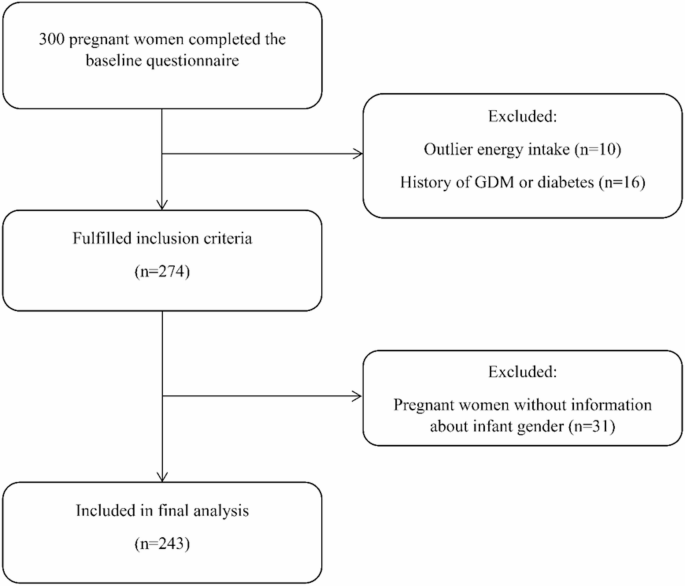
Flowchart of recruitment of pregnant women in the study.
Assessment of dietary intake
The food intake of participants at baseline (third semester) was evaluated by a validated and reliable semiquantitative food frequency questionnaire (FFQ) with 168 items20,21. The participants provided information on how often they consumed each food item during the pregnancy, specifying their intake on a daily, weekly, monthly, or yearly scale. Daily intake of each food item was determined based on the given portion size and consumption frequency, then converted to grams per day using household measures22. Nutrient content was determined using the Nutritionist IV software (First Databank, San Bruno, CA), which had been adapted for Iranian food items.
Calculation of Mediterranean-diet score
We computed the Mediterranean diet score (MDS) according to a method proposed by Trichopoulou et al.23,24. We calculated the median intake of food groups that contributed to a traditional Mediterranean diet. It consists of nine items: (i) whole grains, (ii) vegetables, (iii) fruits, (iv) nuts, (v) legumes and seeds, (vi) fish, (vii) mono-unsaturated fatty acid to saturated fatty acid ratio, (viii) meat (red meat, processed meat, and poultry) and (ix) dairy products. We assign a point if women consumed the first seven items at or above the median and intake below the median was allocated a value of 0. Vice versa, we assign a point if women consumed detrimental items (meat and dairy products) below the median and intake equal to or above the median was assigned 0. We exclude alcohol consumption in the construction of MDS due to the harmful effects of alcohol on pregnant women and religious reasons. We didn’t include whole grains in the Mediterranean score because of the lack of consumption of whole grains in the traditional Iranian diet25. So, the total score is computed based on 8 components (0 to 8).
Outcome assessment
Pre-pregnancy weight was obtained from available records. If records were not accessible, we used self-reported pre-pregnancy weight. In the next step, if self-reported information is not available, we utilized weight documented during the first trimester of pregnancy from existing records. Height was measured by non-elastic tape stuck to the wall while participants wore no shoes. Pre-pregnancy BMI is calculated as divided weight (in kilograms) by the square of height (in meters).
Gestational weight gain was calculated by subtracting the pre-pregnancy weight from the weight recorded at the time of delivery. Based on the guidelines established by the Institute of Medicine (IOM)26, GWG was categorized into three groups (inadequate, adequate, and excessive) depending on the pre-pregnancy BMI. Weight gain below the specified thresholds was categorized as inadequate GWG, while weight gain above these thresholds was classified as excessive GWG; (1) Underweight (BMI < 18.5 kg/m2): 12.8–18 kg; (2) Normal weight (18.5–24.9 kg/m2): 11.5–16 kg; (3) Overweight (25–29.9 kg/m2): 7–11.5 kg; and (4) Obese (BMI ≥ 30 kg/m2): 5–9 kg.
Assessment of other variables
Demographic traits like age, education, occupation, multi-vitamin intake, smoking status, parity, and family history of diabetes were obtained via a structured questionnaire at the start of the study. The socioeconomic status (SES) of women was evaluated by considering household income, number of households, the education of both parents, and their respective occupations. To assess the physical activity (PA) levels of pregnant women in their third trimester, we employed the Pregnancy Physical Activity Questionnaire (PPAQ), a validated instrument created by Chasan-Taber et al.27. The reliability and validity of this questionnaire have been verified in the Iranian community28. The intensity of PA is measured using the Metabolic Equivalent of Task (MET), and the overall PA score is determined as MET-hours per week. Participants were subsequently categorized into three groups according to their MET-hours per week scores, which correspond to low, moderate, and high levels of PA.
Statistical analyses
We calculated MDS and then categorized individuals across tertiles of MDS. Data showed mean ± standard deviation (SD) for continuous variables and frequency as well as percentage for categorical variables. For the calculation of difference across tertiles of MDS, we used one-way analysis of variance and Chi-square test for continuous and categorical variables, respectively. Mean differences in dietary intake were evaluated with analysis of covariance (ANCOVA) which was adjusted with age for energy intake and age and energy for other dietary intakes. We utilized Cox proportional hazard models to assess the association between MDS and GWG in the context of different models that finally presented as hazard ratios (HRs) and 95% confidence intervals (CIs)29. The first model adjusted for age and calorie intake. In the second model, we adjusted for age, energy, education (under diploma and diploma, upper diploma), occupation (housekeeper, employed), physical activity (continuous), SES (low, moderate, high), smoking (never, quit smoker, smoker), parity (primiparous/multiparous), multi-vitamin uses during pregnancy (yes/no). The third model further adjusted for infant gender (boy/girl), GDM (yes/no), pre-pregnancy BMI (underweight and normal, obese, overweight), and family history of diabetes (yes/no). SPSS version 26 (IBM Corp, Armonk, NY, USA) was used for these statistical analyses. For all analyses, P values were two-tailed, and a P value of < 0.05 was considered significant.
Dining and Cooking