

The data for this study were derived from NHANES 2011-2018(https//www.cdc.gov/nchs/nhanes/index.html), which utilized a stratified, multi-stage, probability sampling design that is representative of the national population [25]. NHANES is a publicly available database that has been approved by the Ethics Review Board of the National Center for Health Statistics in the United States [26]. For the NHANES cycles used in this study (2011-2018), the protocol approval numbers are as follows: NHANES 2011-2012: Protocol #2011-17, NHANES 2013-2014: Continuation of Protocol #2011-17, NHANES 2015-2016: Continuation of Protocol #2011-17, NHANES 2017-2018: Protocol #2018-01 (Effective beginning October 26, 2017).
Written informed consent was obtained from all participants. A detailed description of the database has been published [27]. Since the data was derived from NHANES (a publicly available database) and due to the retrospective nature of the study, the Institutional Review Board of Sun Yat-sen Memorial Hospital waived the requirement for ethical approval of this study. The requirement for written informed consent was also waived by the Institutional Review Board. All methods were conducted in accordance with relevant guidelines and regulations [28, 29].
Study population
Initially, the study cohort included 39,156 participants aged 2 years and older from the NHANES 2011-2018 dataset. A systematic application of exclusion criteria was employed to refine this cohort. First, 19,208 participants were excluded due to missing variables needed to estimate asthma. This resulted in a reduced sample size of 19,948 individuals. Subsequently, 10,738 participants were excluded for missing data on diet, leaving 9,210 participants. Further refinement was made by excluding an additional 2,902 participants with missing covariates. Consequently, the final analytic sample comprised 6,308 eligible participants Children aged 3–5 years were included, and participants with missing key variables, dietary data, or covariates were excluded. Ultimately, 1695 children were included in the study, with the participant selection process and the number of participants at each exclusion stage detailed in Figure 1.
Fig. 1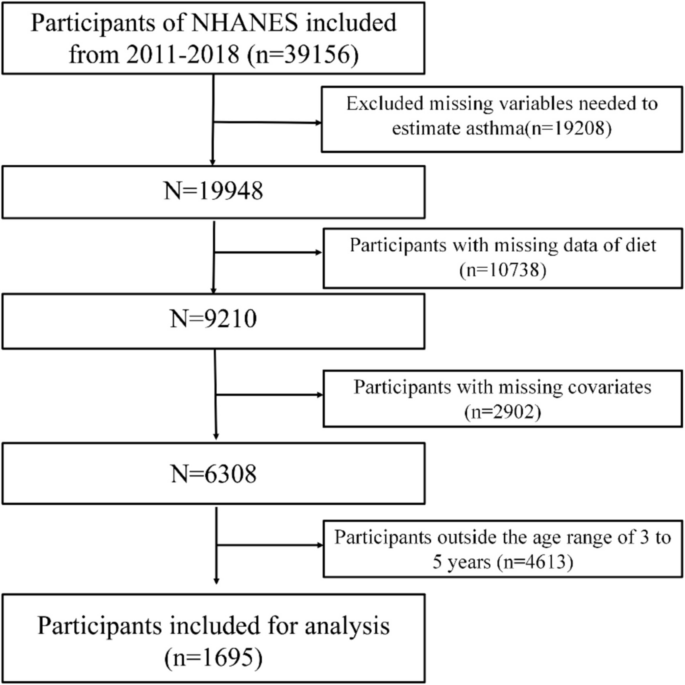
Flowchart depicting the participants’ selection
Exposure and outcomes
The dietary indices included DASH, AHEI, HEI-2020, DII, and MED, with scores calculated from 24-hour dietary recalls [30]. The DASH score is based on eight components (total fat, saturated fat, protein, fiber, cholesterol, calcium, magnesium, and potassium), with scores generated by the sum of all nutrient targets met. Each nutrient target was scored based on whether the recommended intake levels were met, with points summed to generate a total DASH score ranging from 8 to 40 points (Table S1) [31]. The AHEI-2010 score [32], derived from 11 food components and scores, is scored on a 0–110 scale, emphasizing high intake of fruits, vegetables, and whole grains, and low intake of sodium and red and processed meats.
The HEI-2020 score [31, 33], an updated version used to assess adherence to the 2020–2025 Dietary Guidelines for Americans (13 food components, 0–100 points, Table S2), is based on density (e.g., amount per 1000 kcal) rather than absolute amounts. The DII score, developed by Shivappa et al., assesses the potential inflammatory level of diets, with higher scores indicating a more pro-inflammatory diet and lower scores suggesting an anti-inflammatory diet, calculated using 45 food parameters, yielding a total DII value that signifies the overall inflammatory effect of the diet. A positive DII score indicates a pro-inflammatory diet, a negative score points to an anti-inflammatory diet, and a score close to zero suggests little to no impact on inflammation [34, 35]. In our study, the MED score was determined based on nine specific components, which reflected the degree of adherence to the traditional Mediterranean diet. These components included vegetables, legumes, fruits, nuts, whole grains, fish, the ratio of monounsaturated to saturated fats, red meat and processed meat, as well as alcohol. The score for each component was based on whether the intake exceeded the median, with the score ranging from 0 (least adherence) to 9 (highest adherence)(Table S3-4) [36]. For statistical purposes, the dietary index scores were divided into tertiles (T).
Asthma determination is based on an individual’s self-report before diagnosis by a physician in a face-to-face interview. Participants were queried with the following question: “Has a doctor or another health care provider informed you that you have experienced asthma?”.Based on answers to these questions, asthma attacks were divided into an asthma attack subgroup and a no asthma attack subgroup [37].
Covariates
Covariates included gender, age, race (Mexican American, Other Hispanic, Non-Hispanic White, Non-Hispanic Black, Other race), BMI, PIR (Poverty Income Ratio), uric acid, HDL (high-density lipoprotein), LDL (low-density lipoprotein), cholesterol, triglycerides, blood glucose, creatinine, glycated hemoglobin, BUN (blood urea nitrogen), waist circumference (WC), VAI, and LAP. BMI, VAI, and LAP are adiposity indices and also serve as mediators in this analysis. BMI is calculated as weight in kilograms divided by the square of height in meters. VAI and LAP are calculated using specific formulas: for males, LAP is (WC – 65) × TG and VAI is (WC/(39.68 + 1.88 × BMI)) × (TG/1.03) × (1.31/(HDL – C)); for females, LAP is (WC – 58) × TG and VAI is (WC/(39.58 + 1.89 × BMI)) × (TG/0.81) × (1.52/(HDL – C)).
Statistical analysis
Considering the complex sampling design of the survey, our study conducted weighted analyses according to NHANES guidelines [38]. Categorical variables were described using counts and their corresponding percentages, while continuous variables were reported as means ± standard deviations if the data were normally distributed, or medians and interquartile ranges if the data were not normally distributed. For categorical variables, chi-square tests and Rao & Scott corrections were used to determine P-values, and for continuous variables that were skewed or not normally distributed, the Kruskal-Wallis tests were applied to compare these variables across multiple groups. To compare prevalence rates, chi-square tests were conducted to evaluate whether there were significant differences in the distribution of asthma across tertile groups for each dietary index.
Multivariable logistic regression models were used to determine the relationship between the five dietary indices and asthma, with dietary indices represented both as continuous variables and tertiles, using odds ratios (ORs) and their respective 95% confidence intervals (CIs) to present the results. Logistic regression analyses were conducted based on three different models, with Model 1 adjusting for no covariates, Model 2 adjusting for gender, age, race, and BMI, and Model 3 further adjusting for PIR, HDL, LDL, cholesterol, triglycerides and glycohemoglobin. Tertile-based stratification was applied to explore the relationship between dietary indices and asthma risk. Restricted cubic spline (RCS) analysis was used to explore the nonlinear relationship between dietary indices and asthma risk. The mediation analysis was conducted using the R package ‘mediation’, applying logistic regression models to evaluate the indirect effects of dietary indices on asthma through BMI, LAP, and VAI as mediators. The analysis involved estimating paths a (dietary indices to mediators), b (mediators to asthma), and c’ (dietary indices to asthma controlling for mediators). The significance of the indirect effect was assessed using bootstrap methods with 5,000 replications to generate robust confidence intervals. The percentage of the total effect mediated by BMI, LAP, and VAI was calculated by dividing the indirect effect by the total effect and multiplying by 100, thereby quantifying the proportion of asthma risk attributed to these adiposity indices. Multiple imputation methods were used to handle missing data. Statistical significance was accepted at P-values less than 0.05. All statistical assessments were performed using R software version 4.4.2.
Dining and Cooking